
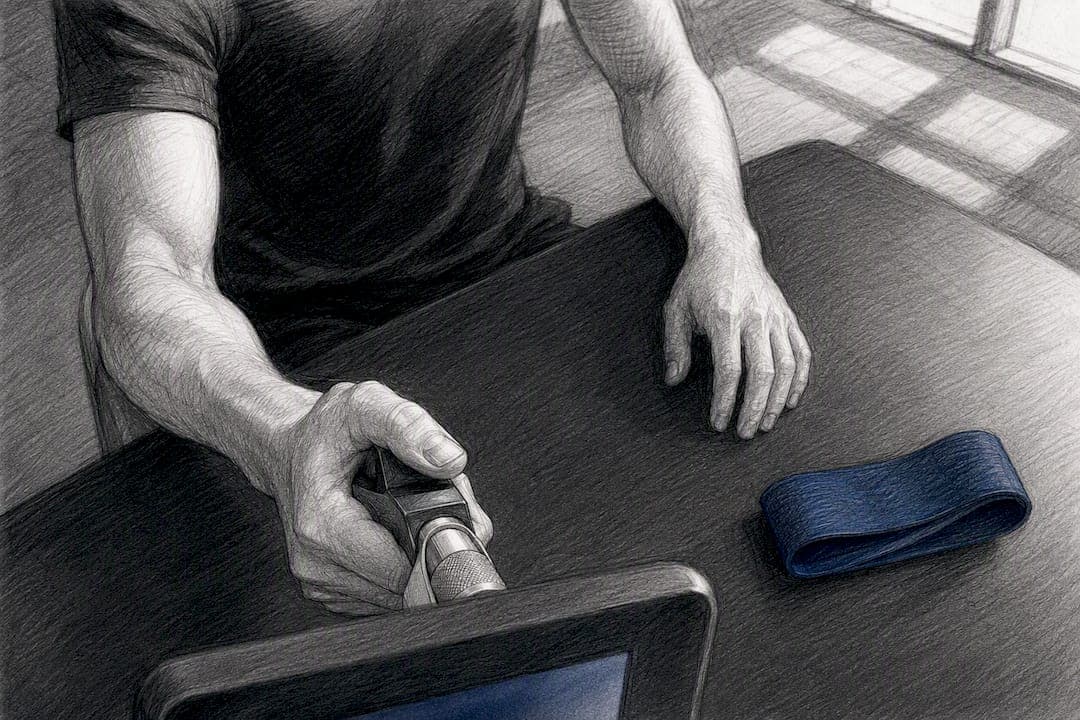
Here, "ulnar nerve grip strength" refers to dynamometer-based grip measurements athletes and clinicians use for performance tracking and left/right symmetry monitoring, not diagnosis. The recommended action: test with a standardized protocol (seated posture, three trials per hand, 10 to 60 seconds rest), log the same handle setting every session, and track trends rather than single readings. An integrated device and app option like Dexdia's DEXDIA GX makes that logging practical in the field.
TL;DR:
- Consistency in setup, handle position, and testing protocol is crucial and should be maintained across all sessions to accurately track small changes.
- Using automated Bluetooth devices like Dexdia's DEXDIA GX minimizes logging errors and provides trend analysis tools that improve monitoring accuracy.
- A baseline should be established from three to five tests over a week, with regular testing intervals and the use of rolling averages to distinguish real trends from noise.
- Symmetry scores above 10% should be flagged, but only treated as significant if persistent over multiple sessions, not based on a single outlier.
- Grip strength reflects nerve function but cannot diagnose nerve issues; consistent tracking helps identify developing problems, which should lead to clinical evaluation.
Table of Contents
- What Is the Standard Ulnar Nerve Grip Strength Testing Protocol?
- How Do You Calculate and Interpret Grip Strength Symmetry?
- How Do You Set Up a Grip Strength Monitoring Plan?
- Which Tools and Metrics Improve Monitoring Sensitivity?
- What Role Does the Ulnar Nerve Play in Grip Function?
- What Conditions Commonly Affect Ulnar Nerve Function and Grip?
- How Do You Tell Ulnar Nerve Issues Apart From Other Grip Deficits?
- What Rehabilitation Approaches Support Grip Strength Recovery?
- How Does Grip Testing Relate to Nerve Conduction Studies?
- What Do Practitioners Get Wrong About Grip Strength Testing?
- How Does Dexdia Support This Testing Workflow?
- Sources
What Is the Standard Ulnar Nerve Grip Strength Testing Protocol?
Measurement noise, not weak grip, is the biggest reason athlete monitoring programs fail. Standardizing setup is the first job, before any data means anything.
The ASHT and Jamar protocols call for a seated or standing position with the shoulder adducted, elbow flexed near 90 degrees, forearm in neutral rotation, and the wrist held between 0 and 30 degrees of extension with 0 to 15 degrees of ulnar deviation. Some reliability data suggests standing may produce more consistent asymmetry scores than sitting, so whichever posture you pick, keep it identical across every session and every athlete on your roster.
Grip handle sizing follows a simple rule: adjust the dynamometer so the second finger joint sits at roughly 90 degrees when gripping. Write down that handle position in your notes. A half-inch difference in handle setting changes peak force output enough to mimic a real strength change on your chart.
- Run one or two practice squeezes so the athlete understands maximal effort.
- Perform multiple maximal trials per hand, alternating sides each time.
- Rest 10 to 60 seconds between trials; many clinical protocols default to the full 60 seconds to control fatigue.
- Record results in kilograms, noting whether you're keeping the peak trial or the three-trial average.
- Log context: time of day, sleep, and any training completed in the prior 24 hours.
Pro Tip: Setup consistency beats trial count for catching small changes. If you're deciding between adding a fourth trial or double-checking elbow angle and handle position, fix the setup first.
How Do You Calculate and Interpret Grip Strength Symmetry?
Percent asymmetry is calculated as the absolute difference between dominant and non-dominant hand scores, divided by the stronger score, multiplied by 100.
That number means little without knowing your measurement error. Bluetooth-enabled dynamometers have shown good-to-excellent test-retest reliability compared with Jamar devices in validation work, though absolute values can differ systematically between device brands.
Typical reliability benchmarks: Studies comparing digital dynamometers against the Jamar gold standard report strong concurrent validity, but the same research flags that switching devices mid-season can introduce an offset that looks like a strength change on a chart when it's really just a different tool.
Practical thresholds for a training context:
- Treat any single asymmetry reading above 10% as a spot-check flag, not an automatic red flag.
- Look for the gap to persist across two or three consecutive sessions before treating it as real.
- Re-test the same day if a result looks like an outlier, checking that handle position and posture matched your protocol.
- Note any contextual factor, like a heavy lifting session the day before, that could explain a one-off dip.
A single low score usually reflects noise, fatigue, or a documentation slip more often than an actual change in ulnar nerve grip strength.
How Do You Set Up a Grip Strength Monitoring Plan?
A baseline built from one test session is a guess dressed up as data. Build a real baseline from three to five measurements collected over a week, ideally at the same time of day and never within 24 hours of an intense training session, since post-activity fatigue skews results low.
- Establish baseline: 3 to 5 sessions in week one, same tester, same device, same time window.
- Set testing cadence: weekly during competitive season, biweekly in the off-season, adjusting for workload spikes.
- Define decision rules before you need them: a sustained drop below baseline, or asymmetry over 10% persisting across sessions, should trigger a workload conversation or clinician review rather than an immediate reaction to one bad test.
- Use a rolling three-session average instead of single-point comparisons to separate a real trend from day-to-day noise.
Data hygiene determines whether any of this holds up. Use the same tester and the same device for a given athlete whenever possible, since device switching introduces the systematic bias noted above. Calibrate hydraulic dynamometers periodically, and always capture sleep quality, muscle soreness, and recent training load alongside the number itself. A guide on grip strength longevity tracking covers how these habits compound into meaningful long-term data.
Pro Tip: Pilot your protocol for two to four weeks before setting hard thresholds. Every roster has its own typical day-to-day variability, and a generic cutoff borrowed from a research paper may not match your athletes.
Which Tools and Metrics Improve Monitoring Sensitivity?
Hydraulic Jamar dynamometers remain the reference standard clinicians compare against, but they require manual logging and offer no built-in trend visualization. Digital, Bluetooth-enabled devices close that gap: they auto-log timestamps, units, and handle settings, which cuts down the documentation errors that quietly corrupt longitudinal data sets.
Grip strength alone can miss nuance for elite athletes. Consider layering in:
- Rate of force development, which flags neuromuscular fatigue before peak strength drops.
- Fatigability across repeated trials, useful for endurance athletes and overhead throwers.
- Submaximal control and steadiness, which accelerometry-paired dynamometry can capture alongside raw force.
- Finger-specific or pinch testing, which some practitioners find more sensitive for certain sport-specific injury mechanisms, such as pitching.
The DEXDIA GX applies this layered approach directly: it pairs a Bluetooth strain-gauge dynamometer with an app that logs handle setting, timestamps, and trial-by-trial results automatically, then builds the trend charts and asymmetry dashboards coaches need without a spreadsheet.
What Role Does the Ulnar Nerve Play in Grip Function?
The ulnar nerve runs from the brachial plexus, behind the medial epicondyle at the elbow (the "funny bone" point), through the forearm, and into the hand via Guyon's canal at the wrist. It supplies the flexor digitorum profundus to the ring and little fingers, most of the intrinsic hand muscles, and the adductor pollicis, which drives thumb adduction against the index finger.
That distribution matters for grip mechanics specifically. Power grip depends heavily on ulnar-innervated intrinsic muscles for stabilizing the ring and little finger flanks of the handle, while the adductor pollicis contributes the thumb-side force that keeps a dynamometer handle from rotating out of the hand during a maximal squeeze. Compression or irritation anywhere along this nerve's path, whether at the elbow or the wrist, can show up as a measurable drop in grip output on that side, sometimes before an athlete notices any sensory change.
This is exactly why symmetry monitoring earns its place in a performance program. A gradual widening of the left/right gap over several weeks, tracked through consistent testing, can surface a developing issue well before it becomes a training-limiting problem, giving a coach or clinician a data point worth investigating rather than a diagnosis to make.
What Conditions Commonly Affect Ulnar Nerve Function and Grip?
Cubital tunnel syndrome, compression of the ulnar nerve at the elbow, ranks among the most common nerve entrapment sites in the upper extremity. Repetitive elbow flexion, prolonged leaning on the elbow, or direct trauma can aggravate it, and athletes in throwing or racquet sports see it disproportionately often due to repeated valgus stress at the elbow.
Guyon's canal syndrome, compression at the wrist, shows up frequently in cyclists and athletes who load their hands against a fixed surface for extended periods, sometimes called "handlebar palsy." Both conditions can produce a measurable decline in grip force on the affected side, along with weakness isolated to ring and little finger flexion or reduced thumb adduction strength.
Traction injuries and stretch-type nerve irritation, common after a shoulder dislocation or forceful elbow hyperextension, can also transiently reduce ulnar-dependent grip output. In these cases, grip strength testing serves a monitoring function: documenting how force output on the affected side trends over weeks of return-to-play programming, not confirming which structure is involved. That confirmation belongs to a qualified clinician using clinical exam findings and, when needed, electrodiagnostic testing.
How Do You Tell Ulnar Nerve Issues Apart From Other Grip Deficits?
Grip strength dynamometry cannot distinguish a nerve problem from a tendon issue, a joint restriction, or simple deconditioning. A dropped score tells you something changed. It does not tell you why.
A few practical monitoring patterns can help a coach or clinician decide whether a finding warrants closer attention, while staying within a performance-tracking role rather than a diagnostic one:
- Pattern of weakness: A drop concentrated in ring and little finger flexion or thumb adduction points toward the ulnar distribution specifically, versus a uniform drop across all fingers, which suggests a more general strength or effort issue.
- Onset speed: A gradual decline over several sessions reads differently than a sudden single-session drop tied to an acute event.
- Associated symptoms: Tingling or numbness in the ring and little fingers alongside a grip decline raises the index of suspicion for nerve involvement, though symptom screening itself sits outside a performance monitoring protocol.
- Musculoskeletal overlap: Wrist tendinopathy, carpal tunnel syndrome (median nerve, thumb-side symptoms), and simple training fatigue can all produce a similar downward trend on a grip chart.
When a trend looks concerning and persists across multiple sessions, the right move is a referral for a proper clinical evaluation, not an attempt to diagnose the cause from dynamometer data alone.
What Rehabilitation Approaches Support Grip Strength Recovery?
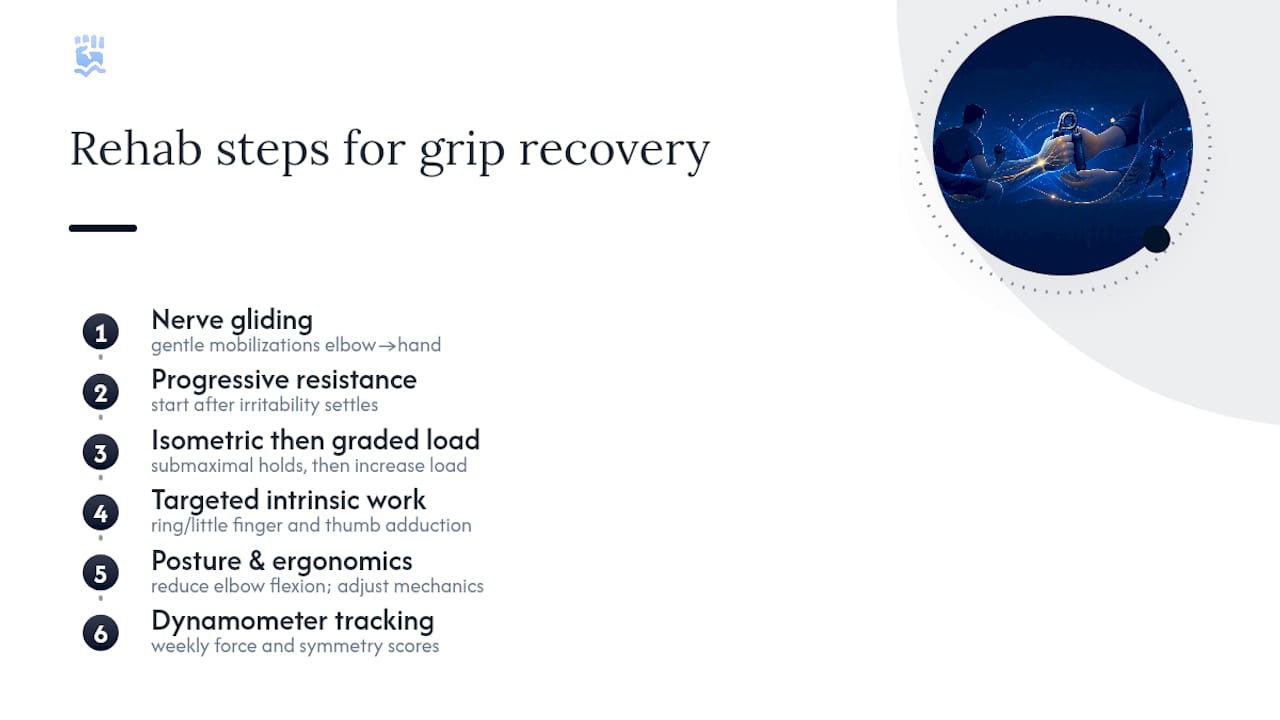
Rehabilitation for ulnar nerve-related grip deficits typically starts with nerve gliding exercises, gentle mobilizations that move the nerve through its available range without provoking symptoms, often introduced early to maintain mobility along the nerve's path from elbow to hand.
Progressive resistance training follows once irritability settles, guided by strength training for longevity principles that support safe and effective muscle recovery. Isometric grip holds at submaximal intensity, followed by graded increases in load, help rebuild strength in the intrinsic hand muscles the ulnar nerve supplies. Specific attention to ring and little finger flexion strength, along with thumb adduction work against resistance, targets the muscle groups most affected by ulnar-specific deficits, distinct from a generic whole-hand strengthening program.
Postural and ergonomic correction matters just as much as the exercises themselves. Reducing prolonged elbow flexion, adjusting cycling handlebar position, or modifying a throwing athlete's mechanics addresses the mechanical stress that often drives the original irritation.
Dynamometer testing fits into this process as an objective progress marker. Tracking grip force weekly through a rehabilitation program, alongside symmetry scores between the involved and uninvolved hand, gives a clinician or strength coach a quantifiable way to gauge whether an intervention is working, rather than relying on subjective reports alone. A structured testing protocol keeps that tracking consistent from the first rehab session through return to full training.
How Does Grip Testing Relate to Nerve Conduction Studies?
Nerve conduction studies (NCS) and electromyography (EMG) measure how well electrical signals travel along the ulnar nerve and how the muscles it innervates respond. Grip strength testing measures the mechanical output of that system. The two capture different things, and neither substitutes for the other.
A clinician might order electrodiagnostic testing to confirm the location and severity of nerve compression. Grip strength data, tracked over the following weeks and months, then shows whether functional output is recovering in step with what the electrodiagnostics predicted, or lagging behind, which can prompt a treatment adjustment. This complementary role is where dynamometry adds the most practical value: it is fast, repeatable, and requires no specialized equipment beyond the dynamometer itself, making it suitable for tracking week over week in a way that repeat electrodiagnostic testing rarely is.
For an athlete or clinician using dynamometer data this way, the mechanical grip readings should be treated as one thread in a larger clinical picture, not a stand-alone stand-in for the nerve conduction findings a physician orders and interprets. Where the two data streams appear to disagree, that mismatch itself is worth flagging to the treating clinician.
What Do Practitioners Get Wrong About Grip Strength Testing?
The most common pitfall is inconsistency dressed up as data. Testing an athlete right after practice, letting handle position drift between sessions, or reacting to a single low score without checking documentation all introduce noise that gets mistaken for signal.
Quick wins fix most of it. Standardize the setup once and write it down. Use a rolling average instead of chasing single sessions. Add finger-specific testing for sports where it genuinely matters, like pitching or climbing, rather than as a blanket addition everywhere.
A 60 to 90 second test-day checklist covers the essentials: confirm handle position matches the logged setting, confirm posture and elbow angle, run three trials per hand with rest between them, and log the time, recent training load, and sleep before moving to the next athlete. That checklist, repeated identically every session, is what makes a trend line trustworthy months later.
— Dexdia Team
How Does Dexdia Support This Testing Workflow?
Every step in this protocol, from handle sizing to alternating-hand trials to rest timing, is exactly what the DEXDIA GX and its companion app were built to standardize. The device logs each trial with a timestamp and unit automatically, so there's no risk of forgetting which handle setting you used three weeks ago or mixing up peak versus average scores across sessions.
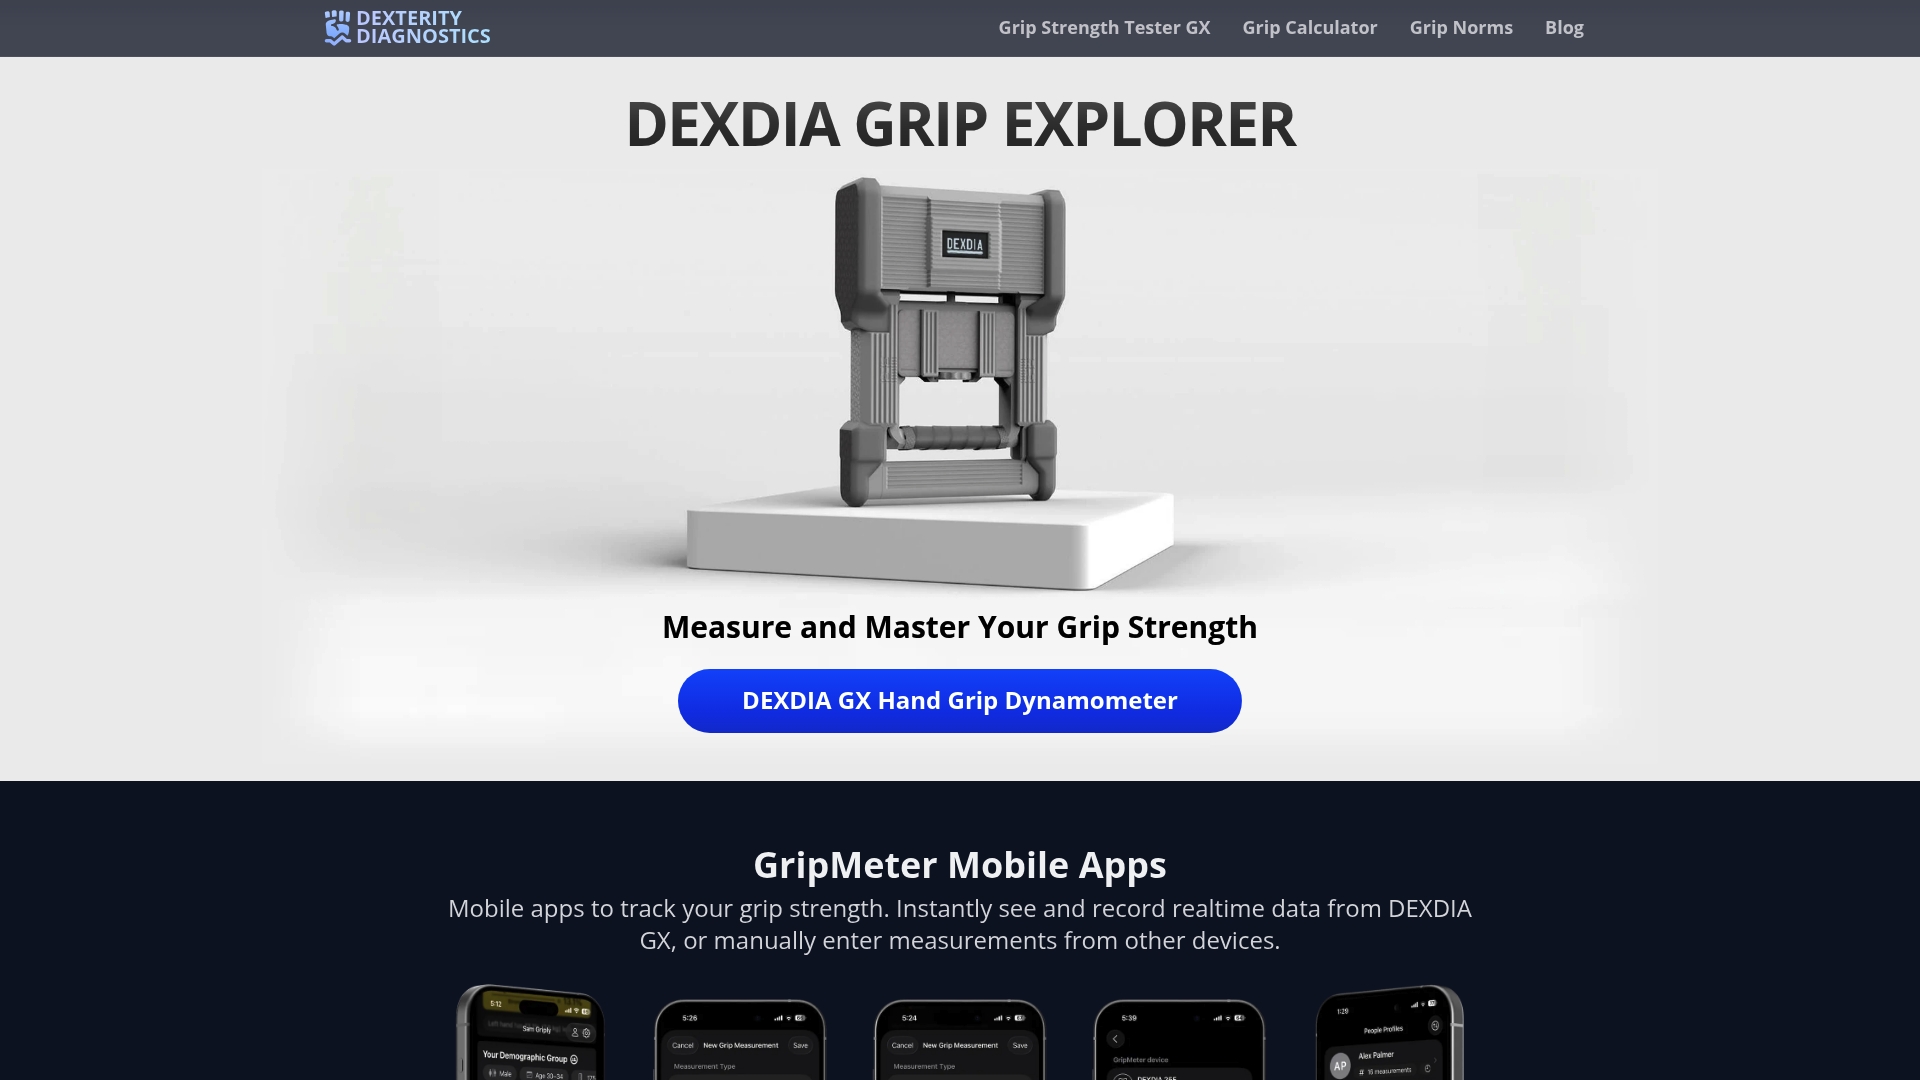
The app turns that raw trial data into the parts of the protocol that are hardest to do by hand: asymmetry dashboards that flag a persistent left/right gap, rolling trend charts that separate real change from single-session noise, and downloadable reports a clinician or coach can review in seconds. For teams managing a full roster, that automated logging is the difference between a monitoring plan that actually gets followed and one that quietly stops after week two.
If you want to see the symmetry math in action before committing to a full testing plan, the grip strength calculator will run the percent asymmetry formula on your own numbers. For a closer look at how the DEXDIA GX dynamometer fits into a season-long monitoring program, the product page walks through the full device-and-app workflow described here.
Sources
- Hand-held dynamometer grip strength (SRAlab) - rehabilitation measures
- Concurrent validity and test-retest reliability of Squegg™ smart dynamometer (PMC)
- Procedure for measuring hand grip strength using the Jamar dynamometer (NIHR Southampton BRC)