
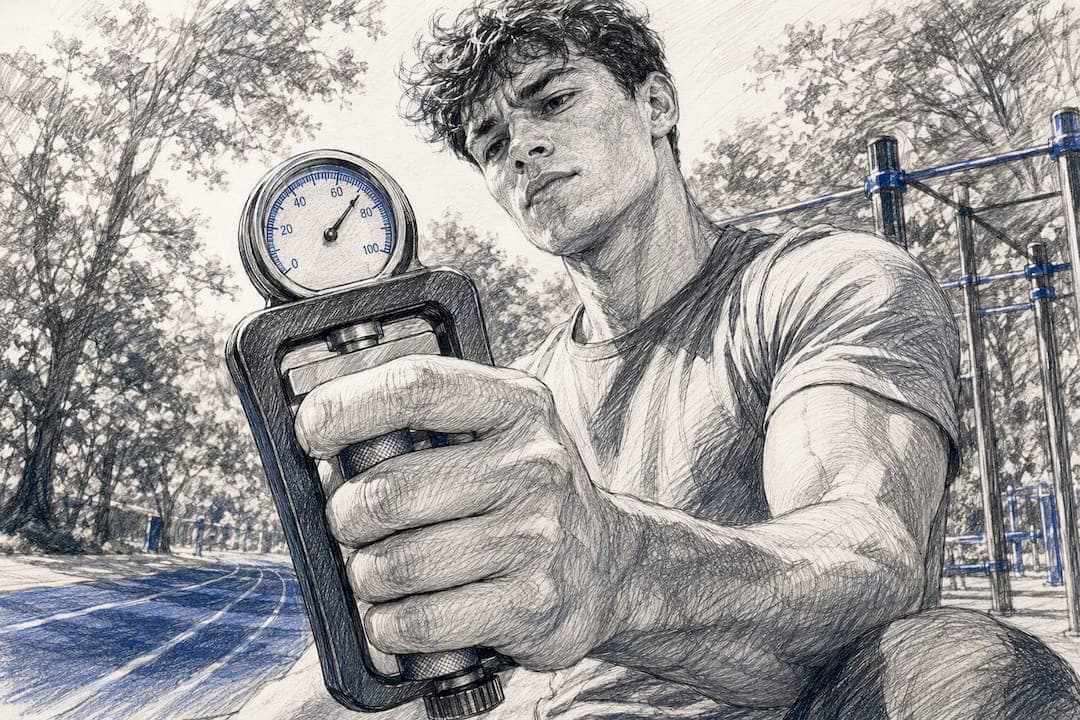
Yes: a calibrated digital dynamometer paired with a standardized protocol and app lets you reliably measure, track, and act on grip strength and left-right symmetry for athletic performance and recovery. The first step is a documented baseline. Run one practice trial, then three maximal trials per hand on the same device, record the mean, and sync the results to an app you'll keep using for months.
TL;DR:
- Measuring grip strength with a calibrated digital dynamometer provides precise, consistent data crucial for tracking athlete development and injury risk.
- Key metrics include peak force, rate of force development, and fatigue curve, with asymmetries over 10% warranting closer monitoring relative to an athlete’s baseline.
- Standardized testing protocols require precise body positioning, multiple maximal trials, and consistent handle settings to ensure reliable longitudinal data.
- Tracking trends over multiple sessions, rather than single measurements, enables differentiation between normal variability and meaningful changes.
- The Dexdia GX device and app streamline data collection, synchronization, and analysis, supporting efficient preseason, in-season, and return-to-play assessments.
Table of Contents
- Why Grip Strength Sarcopenia Tracking Matters for Athletes
- How Do You Run a Standardized Grip Strength Test?
- What Counts as a Meaningful Grip Asymmetry?
- Building a Baseline, Monitoring, and Return-to-Play Workflow
- What Should You Look for in a Grip Dynamometer and App?
- What We've Learned Applying Grip Diagnostics in the Field
- Put This Protocol to Work With DEXDIA GX
- Sources
Why Grip Strength Sarcopenia Tracking Matters for Athletes
Grip metrics are not a novelty for sports and rehab teams. Handgrip strength has become a validated, low-cost tool for monitoring athlete development across disciplines where hand and forearm force transfer directly to performance: pitching and throwing sports, racket sports, climbing, and grappling. A weak or asymmetric grip often shows up before a coach notices a dip in bat speed or a climber's plateau on a route grade.
Bilateral asymmetry gets tracked because smaller left-right differences tend to correlate with better output in many of these sports, while larger gaps can flag unresolved injury or compensation patterns. Peak force alone doesn't tell the whole story, though. Three metrics matter for different reasons:
- Peak force — the standard number for baseline strength and general readiness.
- Rate of force development (RFD) — how fast force builds, critical for explosive, ballistic actions like a fastball or a takedown.
- Fatigue curve — how force output degrades across trials or across a training block, a sensitive early signal of neuromuscular fatigue.
How Do You Run a Standardized Grip Strength Test?
Reliable data starts with position, not effort. The SRAlab protocol calls for the athlete seated, shoulder adducted and neutral, elbow bent at 90 degrees, forearm neutral, wrist in a slight extension, and feet flat on the floor. Note the handle position you use every time. A device set to position two today and position four next month will hand you numbers you can't compare.
The testing sequence itself is short but specific:
- Demonstrate the squeeze and let the athlete run one practice trial to feel the device.
- Give three maximal trials per hand, each a 3 to 5 second squeeze.
- Rest 15 to 60 seconds between trials to avoid cumulative fatigue skewing the data.
- Turn the display away from the athlete during the squeeze and stabilize the device base yourself.
- Record the mean of the three trials per hand, not just the best single effort.
Use one calibrated device for a given athlete's longitudinal record. Switching between a hydraulic, spring-loaded, and strain-gauge dynamometer mid-season introduces variance that has nothing to do with the athlete's actual strength, since different mechanisms produce different absolute values even under identical protocols.
Pro Tip: Script your verbal cues word-for-word and reuse them at every session. Standardized encouragement and a single practice trial measurably improve the odds of a true maximal effort, and inconsistent coaching language is a hidden source of test-retest noise.
What Counts as a Meaningful Grip Asymmetry?
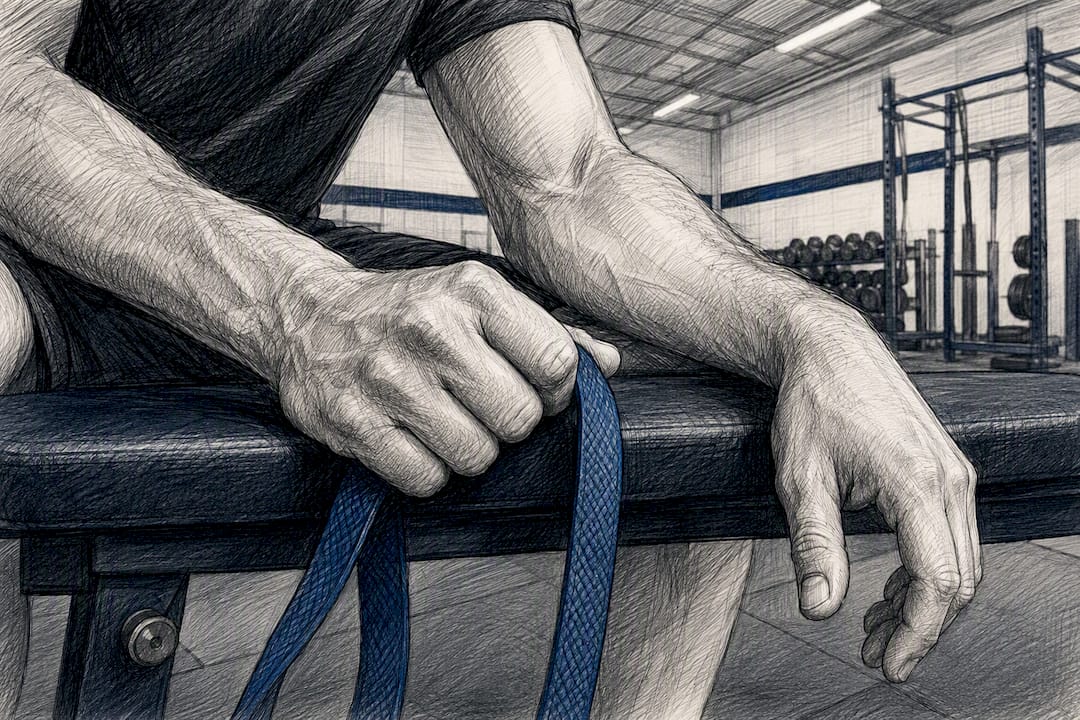
Percent asymmetry is a simple calculation: subtract the weaker hand's score from the stronger hand's score, divide by the stronger hand's score, and multiply by 100. A working flag many practitioners use is a difference greater than 10%, though this should be read against the athlete's own baseline rather than a population average, since individual variation in bilateral asymmetry is substantial and peak force remains the most consistent metric for this calculation even as methodology standardization across the field is still catching up.
RFD matters most for explosive sports. A tennis serve or a wrestling scramble depends on how quickly force ramps up, not just how much force eventually appears, and modern digital dynamometers that capture the full force-time curve can report this alongside peak force.
A single low reading rarely means much on its own. What separates signal from noise is minimal detectable change, the smallest difference that exceeds normal test-retest variability for a given device and protocol. Repeated measures over weeks, not one session, tell you whether a drop is real fatigue or just noise.
- Percent asymmetry above 10% relative to an athlete's own baseline warrants a closer look, not an automatic red flag.
- RFD and fatigue-curve data add value mainly for ballistic, high-velocity sports.
- Trust trends built from repeated sessions over any single data point.
Building a Baseline, Monitoring, and Return-to-Play Workflow
A usable grip program has three phases, and skipping the first one undermines the other two.
- Preseason baseline. Run the full three-trial-per-hand protocol on each athlete and document the averaged scores, the handle setting, and the time of day in the athlete's record.
- Ongoing monitoring. Quick morning trials, once or twice weekly, compared against that baseline. A 5 to 10% acute drop is a reasonable trigger to adjust training load for the day. A drop that persists past 24 to 48 hours points to a recovery deficit that load management alone won't fix.
- Return-to-play decisions. After an upper-limb injury, most sports-medicine workflows look for the injured side to reach roughly 90 to 95% of its own preseason baseline across repeated tests, with asymmetry back under the sport-specific threshold before clearing full activity.
None of this works without consistent record-keeping. A spreadsheet can do it in a pinch, but an app that timestamps every trial removes the guesswork about which session produced which number.
What Should You Look for in a Grip Dynamometer and App?
Not every device on the market produces data worth trusting over a season. A few features separate a tool built for longitudinal tracking from one that just gives a single-session number.
- Electronic strain-gauge measurement over analog hydraulic gauges, for the numeric precision repeated testing demands.
- Adjustable, clearly labeled handle positions, with your chosen setting documented every session.
- Bluetooth sync with timestamped trial logs, so every squeeze lands in the athlete's record automatically instead of on a sticky note.
- Exportable data, ideally CSV, or direct integration with athlete-management software your team already uses.
- Portability and battery life that hold up across a full training day, plus manufacturer support and access to normative data for comparison.
Dexdia's own buying guide for digital hand dynamometers breaks down these criteria in more depth, and a grip size reference is worth checking before you lock in a handle position for the season.
What We've Learned Applying Grip Diagnostics in the Field
Kinesiologists and physical therapists rarely care about one number. What matters is the trend line and the symmetry gap over eight, twelve, twenty sessions. That's where most home-use dynamometers fall short. They give you one score and no way to compare it to last month's, let alone to normative charts by age and sport. Dexdia built its GX device and companion apps around that gap, pairing timestamped Bluetooth logging with interactive normative tools so a coach can see drift before it becomes an injury. We expect to publish proprietary validation data and specialist endorsements as that work matures.
— Dexdia Team
Put This Protocol to Work With DEXDIA GX
Everything in this guide, the seated 90 degree position, the three-trial average, the symmetry math, only pays off if your device actually captures and stores it correctly session after session. The DEXDIA GX dynamometer does that by design: Bluetooth sync pushes every trial straight to the app with a timestamp, so you're never reconstructing last month's numbers from memory or a paper chart.
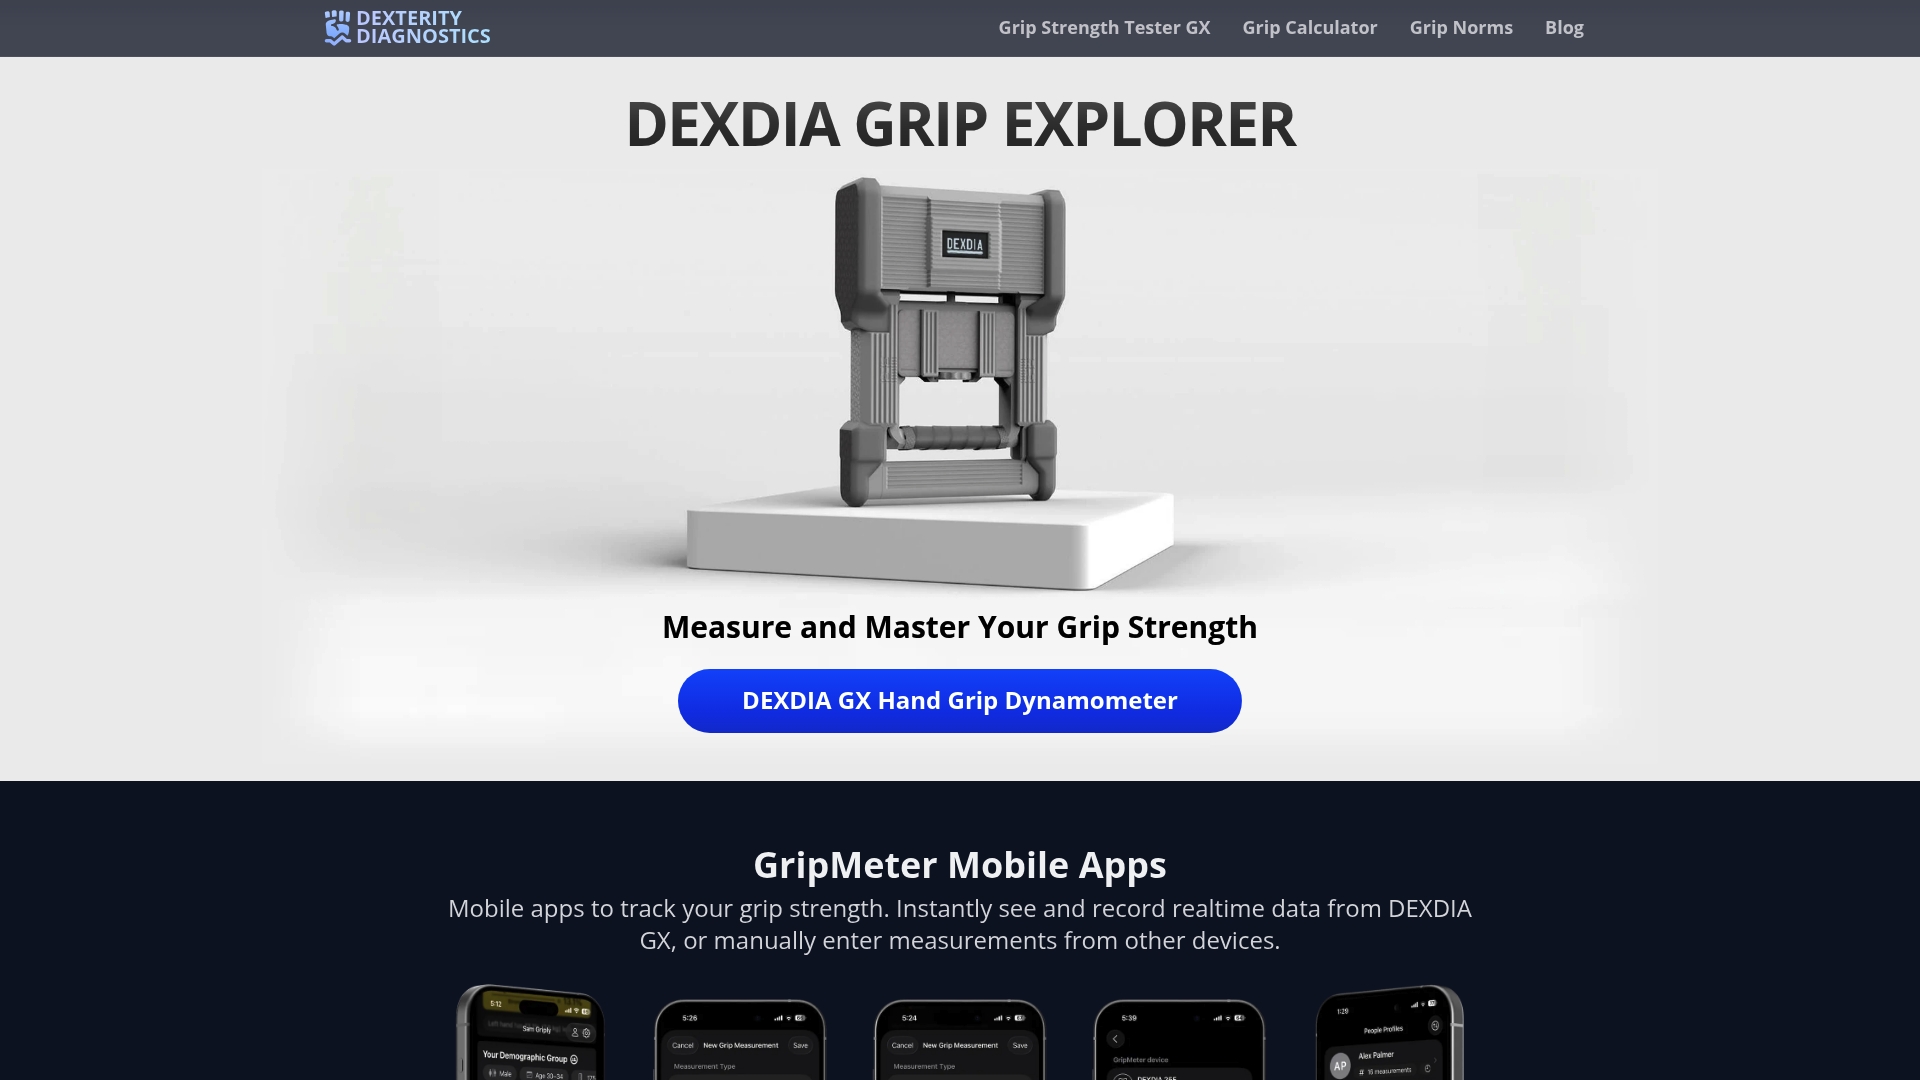
The companion apps calculate left-right symmetry automatically, print reports for an athlete's file, and pull in research-backed normative data by age and sport so a raw score means something the moment it's recorded. That covers the entire workflow this guide walks through, from preseason baseline to return-to-play clearance, without a separate spreadsheet. If you want to see where your own numbers land first, run them through the grip strength calculator or check the normative charts by age and height before deciding whether the GX device fits your setup.
Sources
- Hand-Held Dynamometer: Grip Strength — SRAlab
- Mapping handgrip strength research in sports performance — MDPI (2026)
- Measuring interlimb asymmetry — Manuscript
- Study on familiarization and verbal encouragement effects — PubMed