
Clinicians should use age- and sex-specific percentile curves and compute size-adjusted Z-scores rather than comparing a child's raw kilogram reading to a single average. Consult NHANES-derived centiles, the Kocher et al. (2019) allometric norms, and a calculator like the Dexdia Grip Strength Calculator as first-line references. Flag Z-scores at or below a threshold typically used for clinical concern for further evaluation, and weigh the trajectory across visits more heavily than any single measurement.
TL;DR:
- Using size-adjusted Z-scores and age-specific percentiles from NHANES or Kocher et al. data provides more accurate grip strength assessments than raw kilogram comparisons.
- Consistent testing protocols, including device calibration, child positioning, handle placement, and trial repetition, are essential for reliable and comparable measurements.
- Grip strength below the clinical threshold typically corresponds to a Z-score under -2, signaling the need for further nutritional or neuromuscular evaluation.
- Serial Z-score tracking over time offers greater insight into a child's functional progress than single measurements, especially in rehabilitation or nutritional monitoring.
- Choosing recent, population-representative, and protocol-matched reference data improves the accuracy of clinical judgment, while standard testing should become part of routine pediatric assessments.
Table of Contents
- What Pediatric Grip Strength Norms Exist Today?
- How Should You Standardize Grip Strength Testing in Kids?
- Why Adjust Grip Strength for Body Size in Children?
- What Grip Strength Values Signal a Clinical Concern?
- When Do Standard Norms Not Apply?
- Which Calculators and Charts Should You Use Clinically?
- How Should You Judge Which Reference Study Fits Your Patient?
- Why Consistent Grip Testing Belongs in Every Functional Assessment
- Ready-to-Use Tools for Pediatric Grip Assessment
- Sources
What Pediatric Grip Strength Norms Exist Today?
Reference data for pediatric grip strength comes from several distinct sources, and picking the wrong one for your patient population is a common error. Each dataset covers different ages, uses different sampling methods, and outputs different kinds of values, so matching the reference to the child in front of you matters as much as taking the measurement correctly.
The most methodologically robust option is NHANES-derived smoothed centiles. Because NHANES draws from a large, weighted national sample, the resulting curves account for the fact that grip strength climbs steadily through childhood and then diverges sharply by sex during puberty. A multivariable centile approach built on this kind of data can generate age, sex, height, and BMI-adjusted references simultaneously, which lets you compute both a percentile and a Z-score from one framework. That dual output is why these centiles have become the backbone of modern pediatric interpretation: no single "normal" value exists for a child, since expected grip strength shifts with every year of growth and every stage of puberty, as population studies from cohorts as large as the recent Polish reference sample confirm.
Kocher et al. (2019) took a different but complementary approach. Rather than only reporting raw percentiles, this study built allometric scaling exponents for American children, explicitly correcting for the fact that taller, heavier kids grip harder simply because they are bigger. This matters clinically: a 12-year-old at the 90th percentile for height should not be judged against the same raw kilogram threshold as a 12-year-old at the 10th percentile. Kocher's tables let you strip out that size effect and see whether the strength itself, not just the frame carrying it, is where it should be.
Older but still widely cited, Mathiowetz et al., published in the Archives of Physical Medicine and Rehabilitation in 2015, provides means and standard deviations for children ages 6 to 19. It remains useful for quick screening, but clinicians should treat it with some caution: secular trends in youth strength mean older tables can overstate what a "typical" child today should produce. The Häger-Ross and Rösblad norms, published in Acta Paediatrica in 2002, cover a narrower, younger pediatric band and are most useful when working with preschool and early school-age children where other tables have thin coverage.
Here is how these four core references stack up:
- NHANES-derived centiles: broadest age and sex coverage, supports full Z-score calculation, strongest sampling design.
- Kocher et al. (2019): best for body-size-adjusted comparisons via allometric exponents, American pediatric sample.
- Mathiowetz (2015): fast reference for 6 to 19-year-olds, but values may run high relative to current cohorts.
- Häger-Ross (2002): fills gaps for younger children, though sample size and age range are more limited.
Not every reference reports dominant and non-dominant hand values separately, so check that detail before you select a table for asymmetry work.
How Should You Standardize Grip Strength Testing in Kids?
Comparing a measurement against any normative table only works if the measurement itself was taken the same way the reference data was collected. Variability in posture, device, or trial count introduces noise that can easily exceed the actual clinical signal you are trying to detect.
1. Choose and record the device. Hydraulic dynamometers like the Jamar remain the most widely validated instrument in pediatric literature, but digital and Bluetooth-enabled devices are increasingly common in clinics doing serial tracking. Whatever you use, calibration status and the exact device model need to travel with every measurement, since absolute values shift meaningfully between device types.
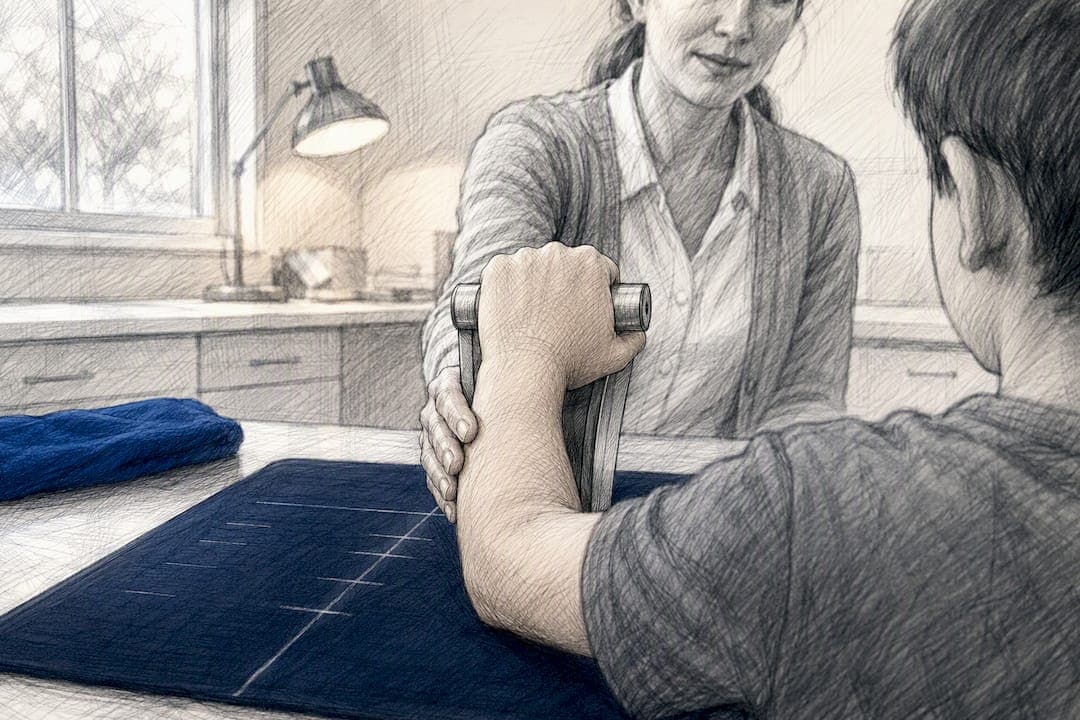
2. Position the child consistently. Seated posture is standard for pediatric protocols: shoulder adducted and neutrally rotated, elbow flexed to 90 degrees, forearm neutral, wrist between 0 and 30 degrees of extension. Standing protocols exist in some adult literature but introduce trunk compensation in kids and should be avoided for normative comparison.
3. Set the handle position appropriately. Match handle width to hand size rather than defaulting to the widest setting, and note which position you used, since handle grip changes peak force output.
4. Run a consistent trial protocol. Most pediatric protocols call for three trials per hand with brief rest between attempts. Reporting practice varies: some references use the maximum trial, others the mean of three. Match your reporting method to whichever the reference table you are using also used, or your Z-score will be systematically off.
5. Test both hands when asymmetry is a concern. Dominant and non-dominant grip differences in typically developing children usually fall under roughly 10%. A gap noticeably beyond that bound, especially if consistent across visits, warrants a closer look at neuromuscular development rather than dismissal as normal variation.
6. Document everything alongside the number. Device, handle setting, posture, trial count, hand tested, and date all belong in the chart note, not just the kilogram value.
Pro Tip: Use the same device for every serial measurement on a given child whenever possible. Switching dynamometer brands mid-treatment can shift readings enough to mimic a real change in strength when none occurred.
A written protocol like the one outlined in hand dynamometer best practices for clinicians is worth posting near your testing station so every staff member follows the same steps.

Why Adjust Grip Strength for Body Size in Children?
Raw grip strength correlates strongly with height, weight, and lean body mass, which means a bigger child will typically out-grip a smaller child regardless of underlying muscle quality. Comparing two kids' raw kilogram scores without accounting for that relationship risks mistaking a size difference for a strength deficit, or the reverse.
Two established methods solve this problem, and they solve it differently.
Allometric scaling divides or exponentiates raw grip strength by a body-size term, typically height or body mass, using an exponent derived from the reference population. Kocher's exponents were built specifically for this purpose, giving you a size-normalized score you can compare across children of different builds. This method works well when you have a single anthropometric variable (say, height) and want a quick, defensible adjustment without needing a full multivariable model.
Multivariable centiles, often built using LMS (lambda-mu-sigma) smoothing, take a broader approach. Rather than a single scaling exponent, they model grip strength as a smooth function of age, sex, height, and BMI simultaneously, producing a predicted value and standard deviation for a child with that exact profile. The resulting Z-score tells you how far the child's actual grip strength sits from what a child of the same age, sex, height, and BMI would be expected to produce.
Multivariable centile methods let clinicians generate age-, sex-, height-, and BMI-adjusted reference centiles, enabling Z-score and change-in-Z calculations for tracking a child longitudinally rather than relying on a single snapshot.
The practical workflow looks like this:
- Record age, sex, height, weight, and hand-tested grip strength at the time of assessment.
- Select a reference matched to the child's age range and, ideally, population characteristics.
- Compute the predicted value from the chosen formula (allometric exponent or multivariable centile equation).
- Calculate the Z-score: (observed value minus predicted value) divided by the reference standard deviation.
- Interpret the Z-score against established clinical thresholds, not the raw kilogram figure.
Which method should you actually reach for? If you only have height and weight on hand and need a fast size adjustment, allometric scaling gets you most of the way there with minimal computation. If you have access to a full multivariable calculator, that approach captures more of the variance, since it adjusts for BMI alongside height rather than treating body size as a single dimension. Clinics doing high-volume screening often lean on a calculator that runs the multivariable math automatically, since manual LMS calculation by hand is impractical during a routine visit.
What Grip Strength Values Signal a Clinical Concern?
A Z-score below a commonly accepted clinical threshold is used to flag a child for further evaluation. That cutoff is not arbitrary. It mirrors the same statistical convention used across pediatric growth and development metrics, where two standard deviations below the expected mean marks a meaningful departure from typical development rather than routine variation.
The clinical stakes behind that number are real. A 2024 hospital-based study found that 28.2% of hospitalized children had lower-than-expected grip strength, and that lower grip was associated with both longer hospital stays and higher rates of malnutrition. That is an association, not proof that weak grip causes longer admissions. Low grip strength is more plausibly a marker of the same underlying nutritional and muscular status driving both outcomes. Still, the correlation is strong enough that a flagged Z-score should prompt a broader look at the child's nutritional and functional status, not just a note in the chart.
A single low grip reading in a hospitalized child is worth investigating on its own, but the strength of the finding comes from what it tends to travel with: reduced lean mass, nutritional deficit, and slower functional recovery.
Trajectory carries more clinical weight than any single reading. A child sitting at the 15th percentile who has held steady there for a year is a very different case from a child who dropped from the 60th to the 15th percentile over six months. Tracking change in Z-score over serial visits, rather than treating each visit as an isolated data point, is how most rehabilitation and nutritional monitoring programs actually use this data.
When a Z-score flags a case, reasonable next steps include:
- A focused nutritional assessment if weight trends or intake history raise concern.
- Referral to physical or occupational therapy for functional strength evaluation.
- A closer look at neuromuscular status if the asymmetry between hands also exceeds typical bounds.
- Repeat measurement at a defined interval to confirm the finding rather than acting on a single data point.
More detail on translating a raw percentile into a clinical decision is covered in Dexdia's grip strength interpretation guide, which walks through why adult benchmarks should never substitute for pediatric-specific curves.
When Do Standard Norms Not Apply?
Reference tables age, and so do the populations they describe. Comparisons across decades show a secular trend toward lower raw grip values in some contemporary cohorts relative to older datasets. That means a table built in the 1990s may systematically overestimate what a "typical" child should produce today, inflating the apparent deficit for a perfectly healthy kid. Whenever a recent, well-sampled alternative exists, prefer it over an older reference, even if the older one is more familiar.
Population differences are another common trap. Ethnicity, geography, and even regional activity patterns can shift the underlying distribution, though size adjustment through allometry or multivariable centiles attenuates a meaningful share of that variation. A reference built primarily from one national sample may fit less precisely for a demographically distinct clinical population, so treat percentile output as a strong estimate rather than an exact match.
Device and protocol heterogeneity compounds both problems. A hydraulic dynamometer and a digital Bluetooth device can produce different absolute readings on the same child, and a table built from one instrument type does not automatically transfer cleanly to another. Documenting device model with every reading, as recommended in Dexdia's grip strength documentation guidance, is what makes future re-analysis possible if you ever need to reconcile results across instruments.
Finally, age-coverage gaps show up in nearly every reference table. Few datasets cleanly cover toddlers through late adolescence with equal sample density at every age. When a child falls in a thin-data band:
- Interpolate cautiously between the two nearest well-sampled age points rather than forcing an exact match.
- Favor a size-adjusted predicted value over a raw comparison when age coverage is sparse.
- Note in the chart that the percentile is an approximation, not a precise reference-matched figure.
Which Calculators and Charts Should You Use Clinically?
Peer-reviewed percentile tables give you the underlying math, but most clinics need a faster path from a measured kilogram value to an interpretable percentile. Several resources fill that gap depending on your workflow.
For a printable, at-a-glance reference during a visit, downloadable percentile tables built from NHANES-derived centiles and Kocher-style adjustments work well for quick clinic screening without needing a device or software in the room.
For calculation-heavy work, the Dexdia Grip Strength Calculator takes a child's age, sex, height, weight, and measured grip value, then returns a percentile and size-adjusted Z-score in one step. It is built for clinical and research use rather than diagnosis. Comparable calculator interfaces exist outside pediatrics too. The Finegym strength standards calculator illustrates the same input-output logic in an adult fitness context, which is a useful comparison if you are evaluating calculator design for your own workflow.
Detailed research assessment, by contrast, usually calls for the underlying reference paper rather than a calculator shortcut. If you need to justify a Z-score methodology in a publication, cite the Kocher allometric norms or the multivariable centile study directly rather than a downstream tool.
Whichever calculator or chart you use, capture this metadata alongside the output:
- Device make and model used for the measurement.
- Handle position and posture (seated, elbow angle).
- Hand tested and dominance status.
- Height, weight, and age at the time of testing.
How Should You Judge Which Reference Study Fits Your Patient?
NHANES-based analyses draw strength from sample weighting: the survey design corrects for demographic composition so the resulting centiles better represent the general population rather than whoever happened to walk into a research clinic. LMS smoothing then fits continuous percentile curves across age rather than relying on rigid age-bracket cutoffs, which avoids awkward jumps at bracket boundaries.
Kocher et al. built their allometric exponents from American pediatric data specifically to correct for body-size confounding, making that reference the more direct choice when your priority is stripping out height and weight effects rather than generating full percentile curves.
Studies differ meaningfully in which hand they tested, what posture they used, and whether they reported maximum or mean trial values, so check those details before adopting any table wholesale. As a general rule, prioritize references that are recent, drawn from a representative sample, and built on a testing protocol matching your own clinic's setup over one that is simply the most familiar or most cited.
Why Consistent Grip Testing Belongs in Every Functional Assessment
Grip strength deserves a permanent spot in pediatric functional assessment panels, not just a role reserved for research protocols. It is fast, inexpensive, and, when interpreted through size-adjusted percentiles rather than raw kilograms, genuinely informative about a child's neuromuscular and nutritional status.
The bigger opportunity clinics miss is serial measurement. A single visit tells you where a child sits relative to peers. A series of visits, using the same device and protocol, tells you where that child is heading. We think that trajectory view deserves more weight in clinical decision-making than it typically receives.
Grip data works best paired with, not instead of, nutritional and broader functional assessment. A flagged Z-score is a prompt to look further, not a diagnosis on its own.
— Dexdia Team
Ready-to-Use Tools for Pediatric Grip Assessment
Dexdia built its Grip Strength Calculator specifically for the workflow described throughout this piece: enter a child's age, sex, height, weight, and measured grip value, and get back a percentile and size-adjusted Z-score without running the LMS math by hand.
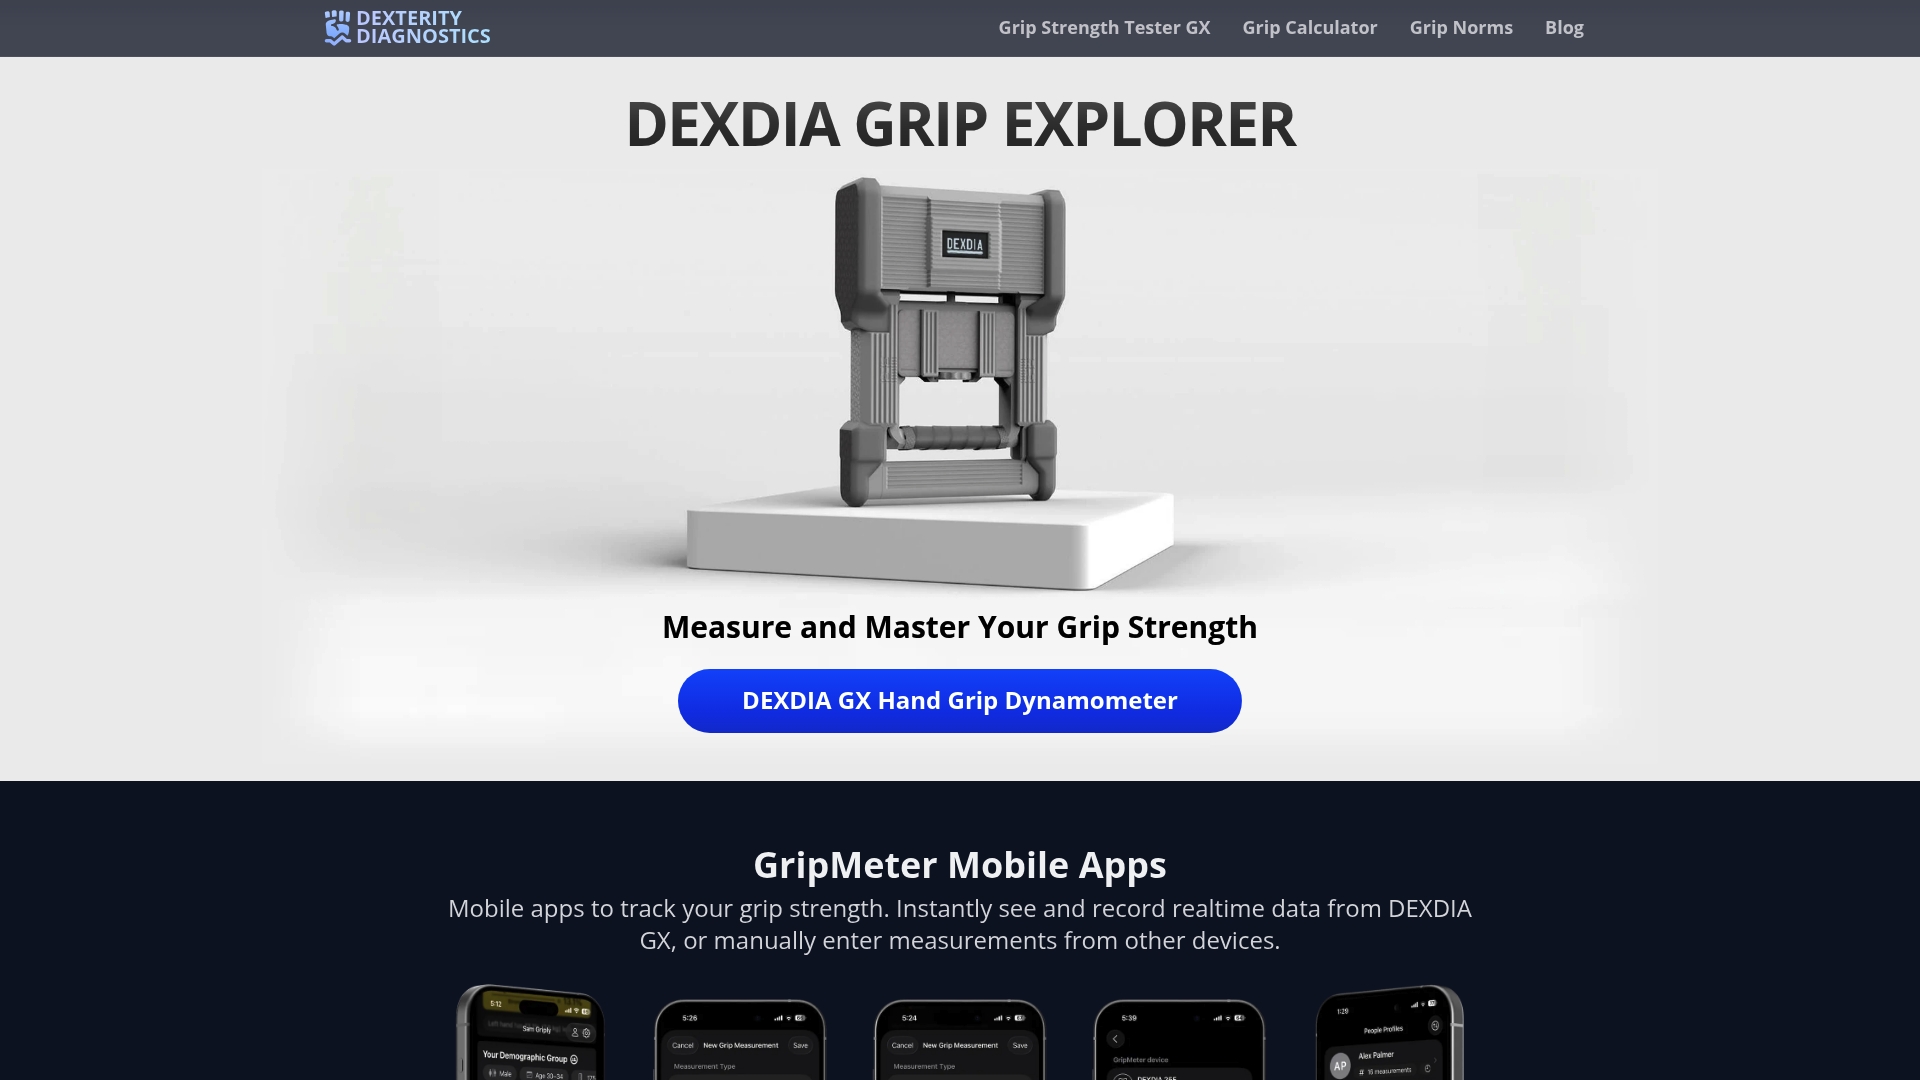
The calculator pairs naturally with the DEXDIA GX, a Bluetooth-enabled dynamometer built for standardized, repeatable readings that sync directly to a tracking app. For clinics running serial measurements on the same patients over months or years, using one consistent device removes a major source of the noise that makes trend interpretation unreliable. Both tools are built for performance and functional assessment, not medical diagnosis. Full regulatory status and intended use is detailed separately, and clinicians, therapists, and researchers should treat outputs as a screening and tracking aid alongside clinical judgment.
If your clinic screens grip strength occasionally, the calculator alone covers the need. If you are tracking patients longitudinally, whether for rehabilitation progress or research cohorts, pairing the calculator with a DEXDIA GX gives you the consistent device and protocol control that serial Z-score tracking depends on. Try the calculator on your next patient measurement, or check the DEXDIA GX product page to see whether standardized device tracking fits your clinic's workflow.
This article is general information, not a substitute for advice from a qualified doctor. Consult a qualified healthcare professional about your own circumstances before acting on anything here.
Sources
- Allometric grip strength norms for American children
- Multivariable reference centiles for maximum grip strength in childhood to young adults
- Study linking low handgrip strength in hospitalized children to adverse outcomes