
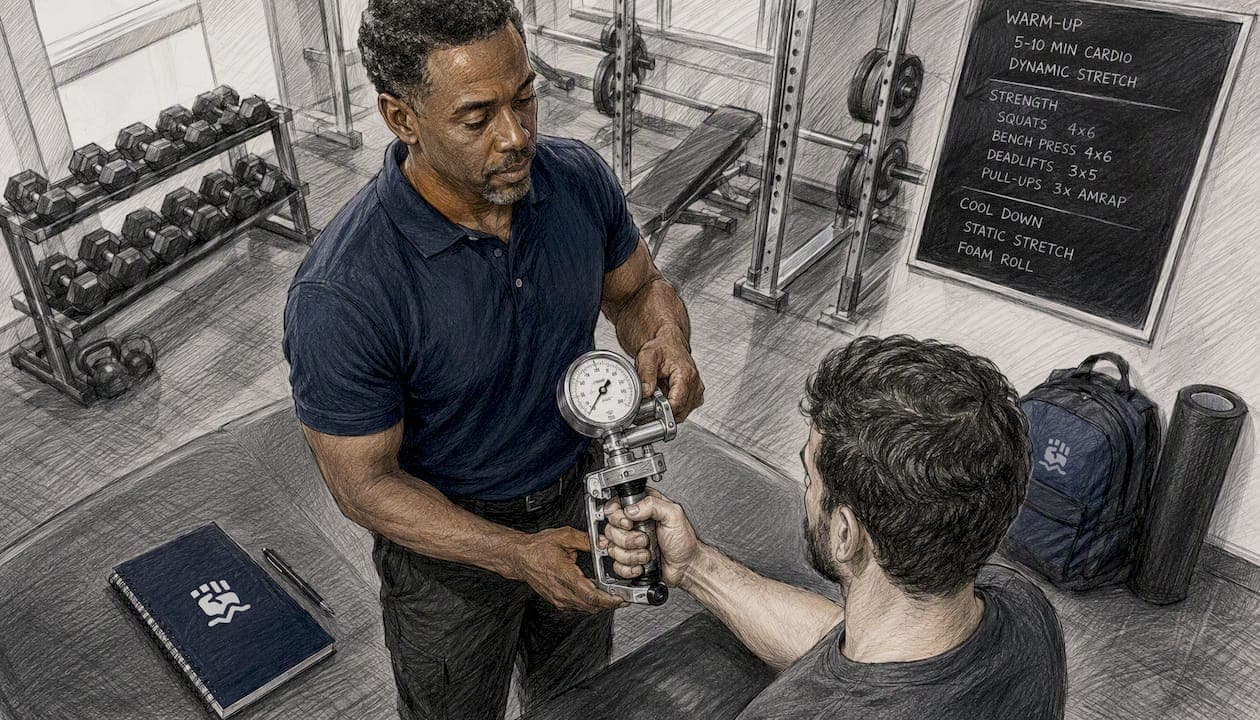
A grip strength reading is a validated proxy for overall skeletal muscle strength and a prognostic biomarker for frailty, hospitalization, and all-cause mortality. For clinical screening, the EWGSOP2 (European Working Group on Sarcopenia in Older People) cut-points are the most widely applied thresholds: scores below 27 kg in men and below 16 kg in women trigger further assessment of muscle mass and physical function. For U.S. patients, the Wang et al. (2018) normative equations and the NIH Toolbox provide age- and sex-specific reference values that allow percentile-based interpretation beyond a binary pass/fail screen. The DEXDIA GX and its companion Grip Strength Calculator translate raw dynamometer output into percentile rankings, symmetry ratios, and minimal detectable change (MDC) flags within a single workflow.
When a score falls near or below a decision threshold, three questions determine the next step:
- Repeat the test? Yes, if the protocol was inconsistent (mixed postures, untimed squeezes, or an uncalibrated device). Retest under a standardized protocol before acting on the number.
- Order further testing? Yes, if the score is below EWGSOP2 cut-points or below the 20th percentile for age and sex. Dual-energy X-ray absorptiometry (DXA) or bioelectrical impedance analysis (BIA) for muscle mass, plus gait speed or chair-rise testing, are the standard next steps.
- Add functional performance tests? Yes, whenever grip strength is used as a sarcopenia screen. Grip alone does not confirm sarcopenia; it initiates the diagnostic pathway.
Table of Contents
- How device type changes the numbers you read
- Standardized measurement protocol for reliable results
- Which normative datasets should you use for U.S. patients?
- How to translate a grip value into clinical decisions
- Understanding measurement reliability and what counts as a real change
- Factors that affect grip strength readings beyond muscle health
- How to document grip strength measurements for future comparability
- Using the DEXDIA GX and Grip Strength Calculator as a clinical workflow
- Key Takeaways
- The limits of grip strength as a single number
- The DEXDIA GX makes norm-referenced grip assessment practical
- Useful sources and further reading
How device type changes the numbers you read
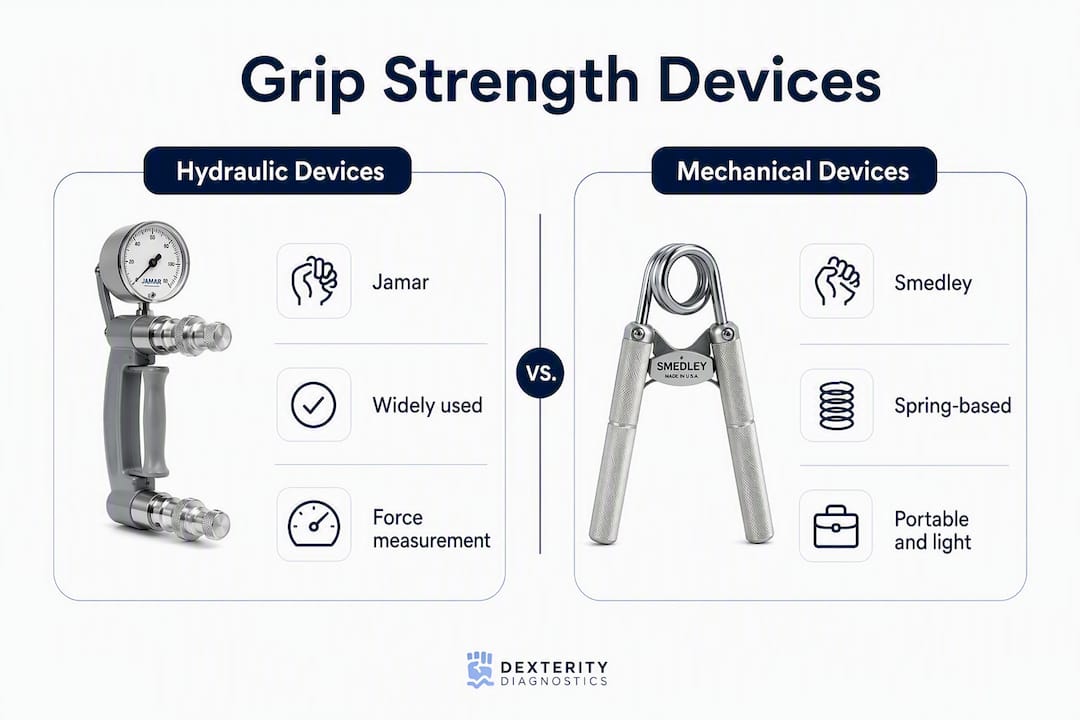
The instrument used to measure grip strength is not interchangeable with other instruments, and this point is frequently overlooked in practice. Published normative datasets were collected with specific devices, so applying a Jamar-based norm to a reading taken on a digital Bluetooth dynamometer introduces systematic error unless the devices have been cross-validated.
Jamar hydraulic dynamometer. The Jamar is the most widely cited reference device in clinical research. Its hydraulic mechanism produces stable, repeatable readings across a broad force range, and the majority of published normative datasets, including the EWGSOP2 cut-points, were derived using Jamar-type instruments. Handle position is adjustable across five settings, and grip span selection directly affects the peak force recorded.
Smedley/Takei mechanical (Baseline) dynamometer. Spring-based rather than hydraulic, the Smedley-type device is lighter and portable. It tends to record slightly different absolute values than the Jamar, particularly at higher force levels where spring compression is less linear. The Baseline dynamometer is a common Smedley-type variant used in field settings and some research protocols.
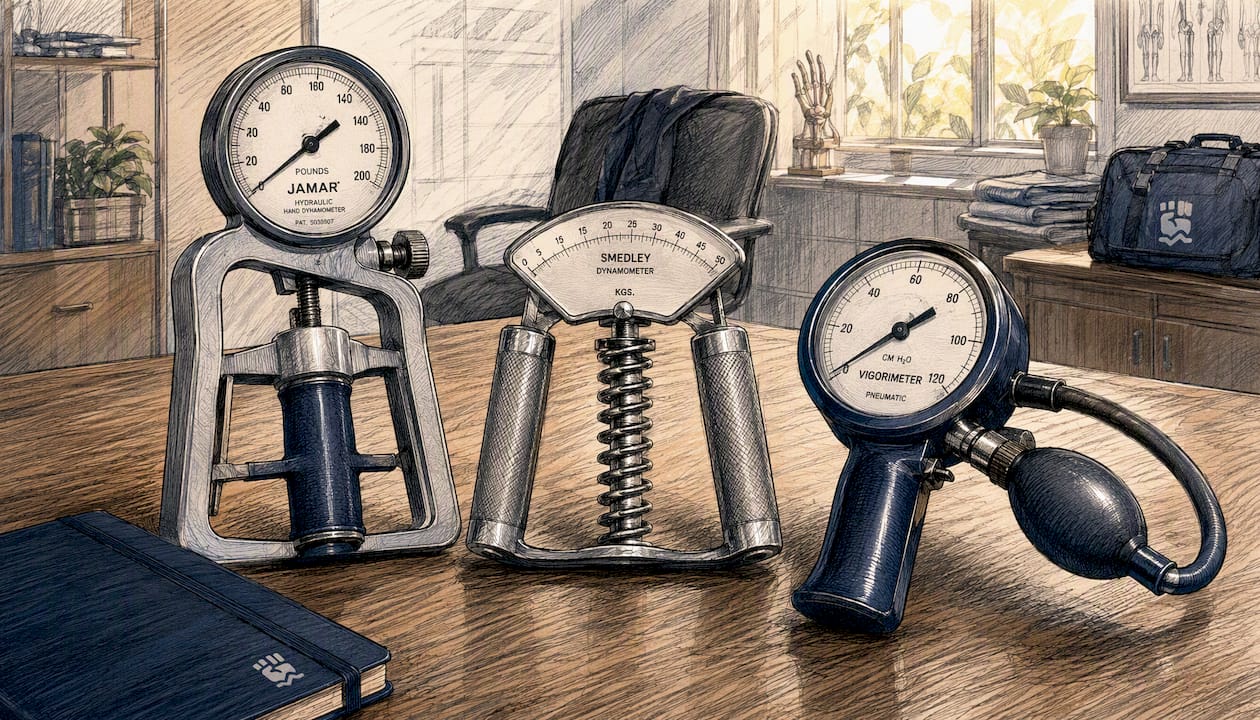
Pneumatic vigorimeter. This device measures grip pressure rather than force, using a rubber bulb and a pressure gauge calibrated in kilopascals (kPa) or bar. It is well-suited for patients with acute hand pain or fragile skin because it requires no pinching of a rigid handle. Norms for the vigorimeter are separate from force-based norms and cannot be directly compared.
Digital Bluetooth dynamometers (DEXDIA GX). Modern digital devices like the DEXDIA GX capture force electronically and transmit data to a companion app in real time. This eliminates manual transcription error and allows automatic protocol timing. Readings are reported in both kg and lb, and the app records device model alongside each test session, which is essential for longitudinal tracking.
Key practical considerations across all device types:
- Record the device make, model, and handle position setting in every clinical note.
- Calibrate regularly; hydraulic devices can drift over time, particularly with heavy use.
- Select handle size based on hand anthropometry. Dexdia's grip size selection guide provides evidence-based span recommendations.
- When switching device types mid-treatment, re-establish baseline measurements on the new device rather than comparing raw values across instruments.
Pro Tip: If your clinic transitions from a Jamar to a digital dynamometer, run a brief cross-calibration session by testing five to ten patients on both devices in the same session. The offset you observe becomes your correction factor for interpreting historical records.
Standardized measurement protocol for reliable results
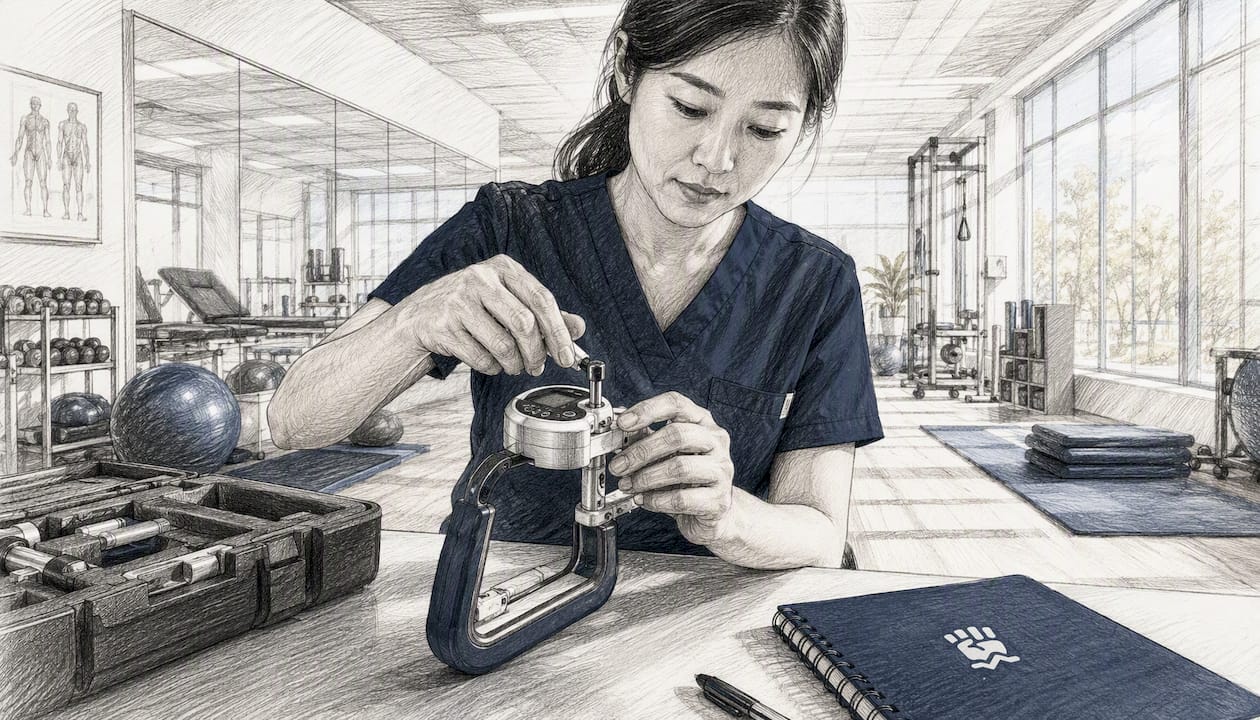
The single most reliable protocol for handgrip measurement is standing, upper arm close to the torso, elbow flexed to 90°, wrist in neutral, three trials per hand, with the mean of three trials recorded as the final score. Deviating from this position, particularly testing seated with the arm unsupported, produces lower and less consistent readings. European reference data confirm that standing values are systematically higher than seated values, which means mixing positions across serial tests introduces a directional bias that can mimic either improvement or decline.
Step-by-step procedure
- Posture. Have the patient stand with feet shoulder-width apart. The upper arm rests against the torso; the forearm is parallel to the floor.
- Elbow angle. Set elbow flexion at 90°. Use a goniometer or a visual reference if a goniometer is unavailable.
- Wrist position. Neutral to slight extension (0–30°). Avoid full flexion or full extension, both of which reduce peak force.
- Handle span. Adjust to the second handle position as a starting default, then individualize based on hand size. The patient's middle finger should form approximately a right angle around the handle.
- Instructions. Say: "Squeeze as hard as you can and hold it." Avoid coaching language that implies a specific duration; instead, time the contraction for 3–5 seconds.
- Force application. Smooth, progressive squeeze over 3–5 seconds. Jerking or rapid-onset force reduces repeatability and risks injury in frail patients.
- Trial cadence. Allow 60 seconds of rest between trials on the same hand. Alternate hands if testing both (right, left, right, left, right, left) to distribute fatigue.
- Number of trials. Three per hand. Record the mean of three as the primary outcome. The maximum of three may be reported as a secondary value for athletic populations.
- Documentation. Record device model, handle position, posture, elbow angle, units (kg or lb), number of trials, statistic used (mean vs. max), and any patient-reported pain or submaximal effort.
| Protocol variable | Recommended standard |
|---|---|
| Posture | Standing, upper arm against torso |
| Elbow angle | 90° flexion |
| Wrist position | Neutral to 30° extension |
| Handle span | Individualized; second position as default |
| Squeeze duration | 3–5 seconds, smooth application |
| Trials per hand | 3 |
| Rest between trials | 60 seconds |
| Reported statistic | Mean of 3 trials |
Pro Tip: Use the same device, the same handle position, and the same tester for every follow-up session. Protocol consistency matters more than protocol perfection. A slightly non-standard protocol applied identically across all visits is more informative than a textbook protocol applied inconsistently.
Which normative datasets should you use for U.S. patients?
Use population-matched, sex- and age-specific normative datasets whenever possible, and prefer U.S.-based references for U.S. patients. The two primary U.S. resources are the Wang et al. (2018) normative equations, which cover ages 18–85 and are derived from a U.S. sample, and the NIH Toolbox, which provides standardized protocols and normative data suitable for U.S. clinical and research benchmarks. When a U.S.-specific reference is unavailable for a particular subgroup, the international pooled norms derived from 2.4 million adults across 69 countries offer a broad benchmark with z-score standardization.
Major normative resources
- International pooled norms (PMC, 2.4M adults, 69 countries) — Sex- and age-specific norms for both absolute grip strength and body-size-normalized values. Useful when U.S. norms are absent for a specific subgroup or when comparing across ethnic groups.
For clinicians who want printable reference charts, Dexdia maintains a normative dataset with height-adjusted charts tailored for U.S. clinical use.
Selected normative reference bands
The table below presents approximate percentile bands from published datasets for common adult age groups. Values reflect absolute grip strength in kilograms for the dominant hand, measured with a Jamar-type dynamometer in a standardized standing protocol. Consult the original Wang 2018 and NIH Toolbox publications for full tables.
| Age group | Sex | P5 (kg) | P50 (kg) | P95 (kg) | Reference |
|---|---|---|---|---|---|
| 20–24 | Male | ~35 | 50 | — | Wang 2018 / Int'l pooled norms |
| 20–24 | Female | ~20 | ~31 | 40 | Wang 2018 / Int'l pooled norms |
| 40–44 | Male | 30 | 45 | — | Wang 2018 / Int'l pooled norms |
| 40–44 | Female | 20 | 25 | ~40 | Wang 2018 / Int'l pooled norms |
| 60–69 | Male | 20 | ~38 | 50 | Wang 2018 / Int'l pooled norms |
| 60–69 | Female | ~15 | 20 | ~34 | Wang 2018 / Int'l pooled norms |
| — | Male | 16 | 25 | 40 | Int'l pooled norms |
| — | Female | ~10 | 16 | 25 | Int'l pooled norms |
Note: These bands are approximate and for orientation only. Always consult the original dataset for the exact values applicable to your patient's age, sex, and device.
Normalization for body size
Raw absolute grip strength values favor larger individuals. When comparing across patients with different body sizes, or when tracking a patient whose weight has changed substantially, normalized values are more informative. Two common approaches:
- Grip strength / BMI (kg/kg·m²). Widely used in sarcopenia research. The EWGSOP2 uses this ratio as one of its muscle strength metrics.
- Grip strength / height² (kg/m²). Preferred in some international datasets because height is more stable than weight over time.
To convert a raw reading to a z-score: subtract the age- and sex-specific mean from the observed value, then divide by the standard deviation from the reference dataset. A z-score below −1.5 to −2.0 corresponds roughly to the 7th–15th percentile and is generally considered a clinically meaningful deviation from the norm.
How to translate a grip value into clinical decisions
The actionable rule is straightforward: use EWGSOP2 cut-points (men <27 kg, women <16 kg) as screening triggers for further assessment of muscle mass and physical function. A score below age- and sex-specific U.S. norms, even when above the EWGSOP2 threshold, warrants investigation of reversible causes and consideration of a progressive resistance training referral.
The prognostic evidence for low grip strength is substantial. Large cohort analyses link lower grip strength to increased all-cause mortality, cardiovascular events, and cognitive decline. Grip strength functions as an indicator of overall physiological reserve, not just hand function, which is why a low score justifies a broader clinical workup rather than a hand-specific intervention alone.
Grip strength is increasingly proposed as a clinical vital sign because it is low-cost, quick to perform, and strongly predictive of important health outcomes — making it practical for routine screening in primary care and rehabilitation settings.
Triage checklist by severity
- Near-normal (above 40th percentile for age/sex). Reassure, document baseline, and retest at the next scheduled visit or annually.
- Below age/sex norms but above EWGSOP2 cut-points (20th–40th percentile). Investigate reversible causes: recent immobilization, acute illness, poor nutrition, or suboptimal effort. Begin monitoring more frequently and consider a strength-focused exercise referral.
- Below EWGSOP2 cut-points (men <27 kg, women <16 kg). Confirm protocol and repeat. If confirmed, order muscle-mass assessment (DXA or BIA), evaluate nutritional status, and test relevant biomarkers including vitamin D, ferritin, and, when clinically indicated, IGF-1 and testosterone. Add gait speed or five-times chair-rise testing to complete the sarcopenia screen.
- Acutely low with pain or neurologic symptoms. Do not interpret as a chronic strength deficit. Address the acute condition first, then retest after resolution.
Recommended clinical next steps for confirmed low scores
- Verify the measurement protocol was standardized before acting on the result.
- Repeat the test on the same device under the same conditions.
- Order DXA or BIA to assess muscle mass and confirm or rule out sarcopenia.
- Evaluate nutrition: protein intake, caloric adequacy, and micronutrient status.
- Test biomarkers where clinically indicated: vitamin D, ferritin, IGF-1, testosterone.
- Refer to a physical therapist or certified strength and conditioning specialist for progressive resistance training.
- Schedule a follow-up grip test at 6–12 weeks to assess response to intervention.
A note on cut-point applicability: the EWGSOP2 thresholds were derived primarily from European populations. Authors of the Lee et al. review explicitly recommend using region-specific norms when available, because stature and ethnicity influence absolute grip strength values. For U.S. patients, Wang 2018 and NIH Toolbox norms are the preferred benchmarks; EWGSOP2 cut-points serve as a secondary safety net for identifying the most severe cases.
For a deeper look at grip strength's predictive value for heart and brain health, Dexdia's clinical resource pages provide evidence summaries organized by outcome domain.
Understanding measurement reliability and what counts as a real change
A change in grip strength over time is only meaningful if it exceeds the measurement error inherent in the testing procedure. Two statistics define this boundary: the intraclass correlation coefficient (ICC) and the minimal detectable change (MDC).
ICC quantifies the proportion of total score variance attributable to true between-subject differences rather than measurement error. ICC values above 0.90 indicate excellent reliability; most standardized grip protocols using hydraulic or digital dynamometers achieve this range. Lower ICCs emerge when protocol is inconsistent, the tester changes between sessions, or the patient's effort varies.
MDC is the minimum change in score that exceeds measurement noise at a specified confidence level (typically 95%). The MDC95 is calculated as:
MDC95 = 1.96 × SEM × √2
where SEM (standard error of measurement) is derived from the ICC and the standard deviation of the sample. In practical terms, an MDC95 of approximately 4–6 kg is commonly reported for standardized Jamar protocols in adult populations, though the exact value depends on the sample and protocol. A change smaller than the MDC cannot be distinguished from random variation.
Protocol consistency is the single largest modifiable driver of reliability. Maintaining a standardized testing position across serial sessions yields substantially better repeatability than allowing position to vary between visits.
Common sources of measurement error
- Protocol deviation. Changing posture (seated vs. standing), elbow angle, or handle position between sessions introduces systematic bias.
- Device calibration drift. Hydraulic dynamometers can lose calibration accuracy with heavy use. Digital devices should be verified against a known load periodically.
- Hand pain or neurologic impairment. Both depress performance independently of true muscle strength. Document pain scores alongside grip values.
- Tester instruction differences. Verbal encouragement and instruction phrasing affect peak force output. Standardize the script.
- Learning and fatigue effects. First-session values are sometimes lower due to unfamiliarity. A brief familiarization trial before formal testing reduces this effect.
- Time of day. Grip strength tends to be slightly higher in the afternoon than in the morning. Consistent testing time reduces this source of variation.
Practical rule: When a serial result falls near a clinical decision threshold (e.g., within 3 kg of the EWGSOP2 cut-point), retest within one to two weeks under identical conditions before making a clinical decision. A single measurement near a threshold is insufficient to confirm or rule out a meaningful change.
Factors that affect grip strength readings beyond muscle health
Age, sex, body size, hand dominance, acute pain, neurologic conditions, and device or protocol differences are the primary drivers of variation in grip strength scores. Misinterpreting a score without accounting for these factors leads to both false positives (flagging a healthy large-framed man as low-risk because his absolute value is high) and false negatives (missing a frail older woman whose score is above the EWGSOP2 threshold but well below her age-matched peers).
Key confounders and their effects
- Age. Grip strength peaks in the mid-30s in most populations, remains relatively stable through the 40s, then declines progressively from approximately age 50 onward. The rate of decline accelerates after age 70. Age-matched norms are non-negotiable for meaningful interpretation.
- Sex. Men produce substantially higher absolute grip values than women across all age groups. Sex-specific norms are required; applying male cut-points to female patients will miss the majority of low-strength cases.
- Body size. Taller, heavier individuals tend to produce higher absolute grip values. Normalized measures (grip/BMI or grip/height²) reduce this confounding effect when comparing across body types.
- Hand dominance. The dominant hand typically produces 5–10% higher force than the non-dominant hand. Symmetry ratios below approximately 90% (non-dominant/dominant) may indicate unilateral impairment worth investigating.
- Occupation and sport. Manual laborers, rock climbers, and throwing athletes often show grip values well above age-sex norms. Interpreting their scores against general population norms may underestimate relative decline.
- Acute pain or injury. Carpal tunnel syndrome, trigger finger, recent fracture, or acute inflammatory arthritis all depress grip output independently of muscle mass. Always ask about hand pain before testing.
- Neurologic conditions. Stroke, peripheral neuropathy, multiple sclerosis, and Parkinson's disease affect grip strength through mechanisms distinct from sarcopenia. Grip values in these populations require condition-specific interpretation frameworks.
- Genetics and training history. Both contribute to baseline grip strength. Dexdia's resource on whether grip strength is genetic or learned summarizes the evidence on heritability versus trainability.
Pro Tip: When an unexpected low score appears in a patient who seems otherwise robust, run a brief checklist before ordering further testing: acute hand pain, paresthesia, recent immobilization, recent illness, and whether the patient understood the maximal-effort instruction. Effort indicators, such as the shape of the force-time curve on a digital dynamometer, can flag submaximal performance.
How to document grip strength measurements for future comparability
A grip strength record is only as useful as the metadata attached to it. A raw number with no context, such as "42 kg right hand," cannot be reliably compared to a future measurement taken on a different device, in a different posture, or by a different tester. The following fields are mandatory for any clinical or research record.
Mandatory documentation fields
- Date and time of test
- Device make and model (e.g., DEXDIA GX, Jamar Plus+, Baseline hydraulic)
- Handle position / grip span setting (e.g., position 2, 5.5 cm)
- Posture (standing or seated)
- Elbow angle (90° or specify deviation)
- Number of trials per hand
- Statistic reported (mean of 3, maximum of 3)
- Units (kg or lb)
- Hand dominance (right/left dominant)
- Patient-reported pain (0–10 NRS or "none reported")
- Effort assessment (full effort, submaximal, or unable to assess)
Example EHR entry
Grip strength assessment — March 14, 2026. Device: DEXDIA GX (Bluetooth digital). Handle span: position 2 (5.5 cm). Posture: standing, elbow 90°. Trials: 3 per hand. Statistic: mean of 3. Units: kg. Right (dominant): 38.2 kg. Left: 35.6 kg. Symmetry ratio: 93%. Pain: none reported. Effort: full. Normative reference: Wang 2018 U.S. norms, age 58, male. Percentile: approximately 42nd. No EWGSOP2 threshold breach.
For clinics using the DEXDIA GX, the companion app automatically captures device model, trial data, and timestamps, then exports a structured report to PDF or CSV for EHR integration. This eliminates transcription error and ensures the metadata fields above are populated consistently across every session. Dexdia's guidance on when to measure grip strength covers clinical timing considerations for baseline, post-operative, and rehabilitation contexts.
Using the DEXDIA GX and Grip Strength Calculator as a clinical workflow
An integrated hardware-plus-calculator workflow reduces documentation error, automates normalization to U.S. norms, and produces a structured report in a fraction of the time required by manual methods. The DEXDIA GX captures force data via Bluetooth, syncs to the companion app in real time, and feeds directly into the Grip Strength Calculator, which converts raw values into age- and sex-matched percentiles, symmetry ratios, and MDC flags.
Workflow steps
- Acquisition. Conduct the standardized three-trial protocol using the DEXDIA GX. The app timestamps each squeeze and records the force-time curve.
- Auto-sync. Data transfers to the app automatically over Bluetooth. No manual entry required.
- Select normative dataset. Choose the appropriate reference (Wang 2018-type U.S. norms, NIH Toolbox-aligned values, or the international pooled dataset) based on the patient's demographics.
- View percentile and MDC estimates. The calculator displays the patient's percentile rank, flags scores below EWGSOP2 cut-points, and indicates whether a change from the previous session exceeds the MDC.
- Symmetry analysis. The app computes the left-to-right ratio and flags asymmetries that may indicate unilateral impairment.
- Export. Generate a PDF report or CSV export for EHR integration. The report includes device model, protocol metadata, raw values, percentile rank, and normative reference used.
The Dexdia Team maintains printable grip strength norms that clinicians can download and include in paper-based records or patient handouts. For practitioners who want to run a quick norm comparison without the full device workflow, the Grip Strength Calculator is available as a standalone web tool.
One important reminder: the MDC flags and percentile outputs are only valid when the same device and protocol are used across serial sessions. Switching from a Jamar to the DEXDIA GX mid-treatment without re-establishing a baseline on the new device will produce percentile shifts that reflect device differences, not true physiological change.
Key Takeaways
Accurate grip strength interpretation requires a standardized protocol, a population-matched normative reference, and an MDC threshold to distinguish real change from measurement noise.
| Point | Details |
|---|---|
| EWGSOP2 screening thresholds | Scores below 27 kg (men) or 16 kg (women) trigger further muscle-mass and functional assessment. |
| Protocol consistency | Standing, elbow at 90°, mean of three trials; any deviation reduces comparability across sessions. |
| Use U.S.-matched norms | Wang 2018 and NIH Toolbox are the preferred references for U.S. patients; international pooled norms (2.4M adults, 69 countries) fill gaps. |
| MDC before acting on change | A serial change must exceed the MDC95 (typically 4–6 kg for standardized protocols) to be considered real. |
| Dexdia workflow | The DEXDIA GX with the Grip Strength Calculator automates normalization, symmetry analysis, and MDC flagging for clinical and performance use. |
The limits of grip strength as a single number
Grip strength is one of the most useful single-item screening tools in clinical practice. It is fast, inexpensive, and backed by decades of cohort data linking low scores to meaningful health outcomes. That said, the Dexdia Team wants to be direct about where the metric's usefulness ends and where clinicians sometimes overextend it.
The most common pitfall is treating a grip value as a standalone diagnostic conclusion. A score below the EWGSOP2 threshold does not confirm sarcopenia; it initiates the diagnostic pathway. Sarcopenia requires evidence of low muscle mass in addition to low strength, and grip strength alone cannot provide that evidence. Clinicians who act on grip strength without ordering muscle-mass assessment are using a screening tool as a diagnostic test, which it was never designed to be.
A second persistent problem is mixing devices across serial tests without documentation. A patient who scores 34 kg on a Jamar in January and 31 kg on a digital dynamometer in June has not necessarily lost strength. The 3 kg difference may reflect device offset rather than physiological change. This is not a theoretical concern; it happens routinely in clinics that upgrade equipment mid-treatment without re-establishing baselines.
Misapplying population cut-points across ethnic groups is a subtler but equally important issue. The EWGSOP2 thresholds were derived from European cohorts. Applying them directly to Asian American, Hispanic, or African American patients without consulting ethnicity-appropriate references can produce both false positives and false negatives. The international pooled norms offer a broader benchmark, but region-specific data remain the gold standard where available.
Finally, grip strength used in isolation misses the prognostic picture that emerges when it is combined with other functional measures. Gait speed, chair-rise time, and balance testing each add independent predictive value. A patient with low grip strength and slow gait speed carries a substantially different risk profile than one with low grip strength alone. The trajectory of grip strength over time, rather than any single reading, is often the most clinically informative signal.
The DEXDIA GX makes norm-referenced grip assessment practical
Clinicians and sports performance specialists who want a reproducible, norm-referenced grip assessment without the manual calculation burden have a direct path with the DEXDIA GX. The device captures standardized three-trial protocols via Bluetooth, syncs to the companion app automatically, and feeds the Grip Strength Calculator to produce percentile rankings, symmetry ratios, and MDC flags in a single session.
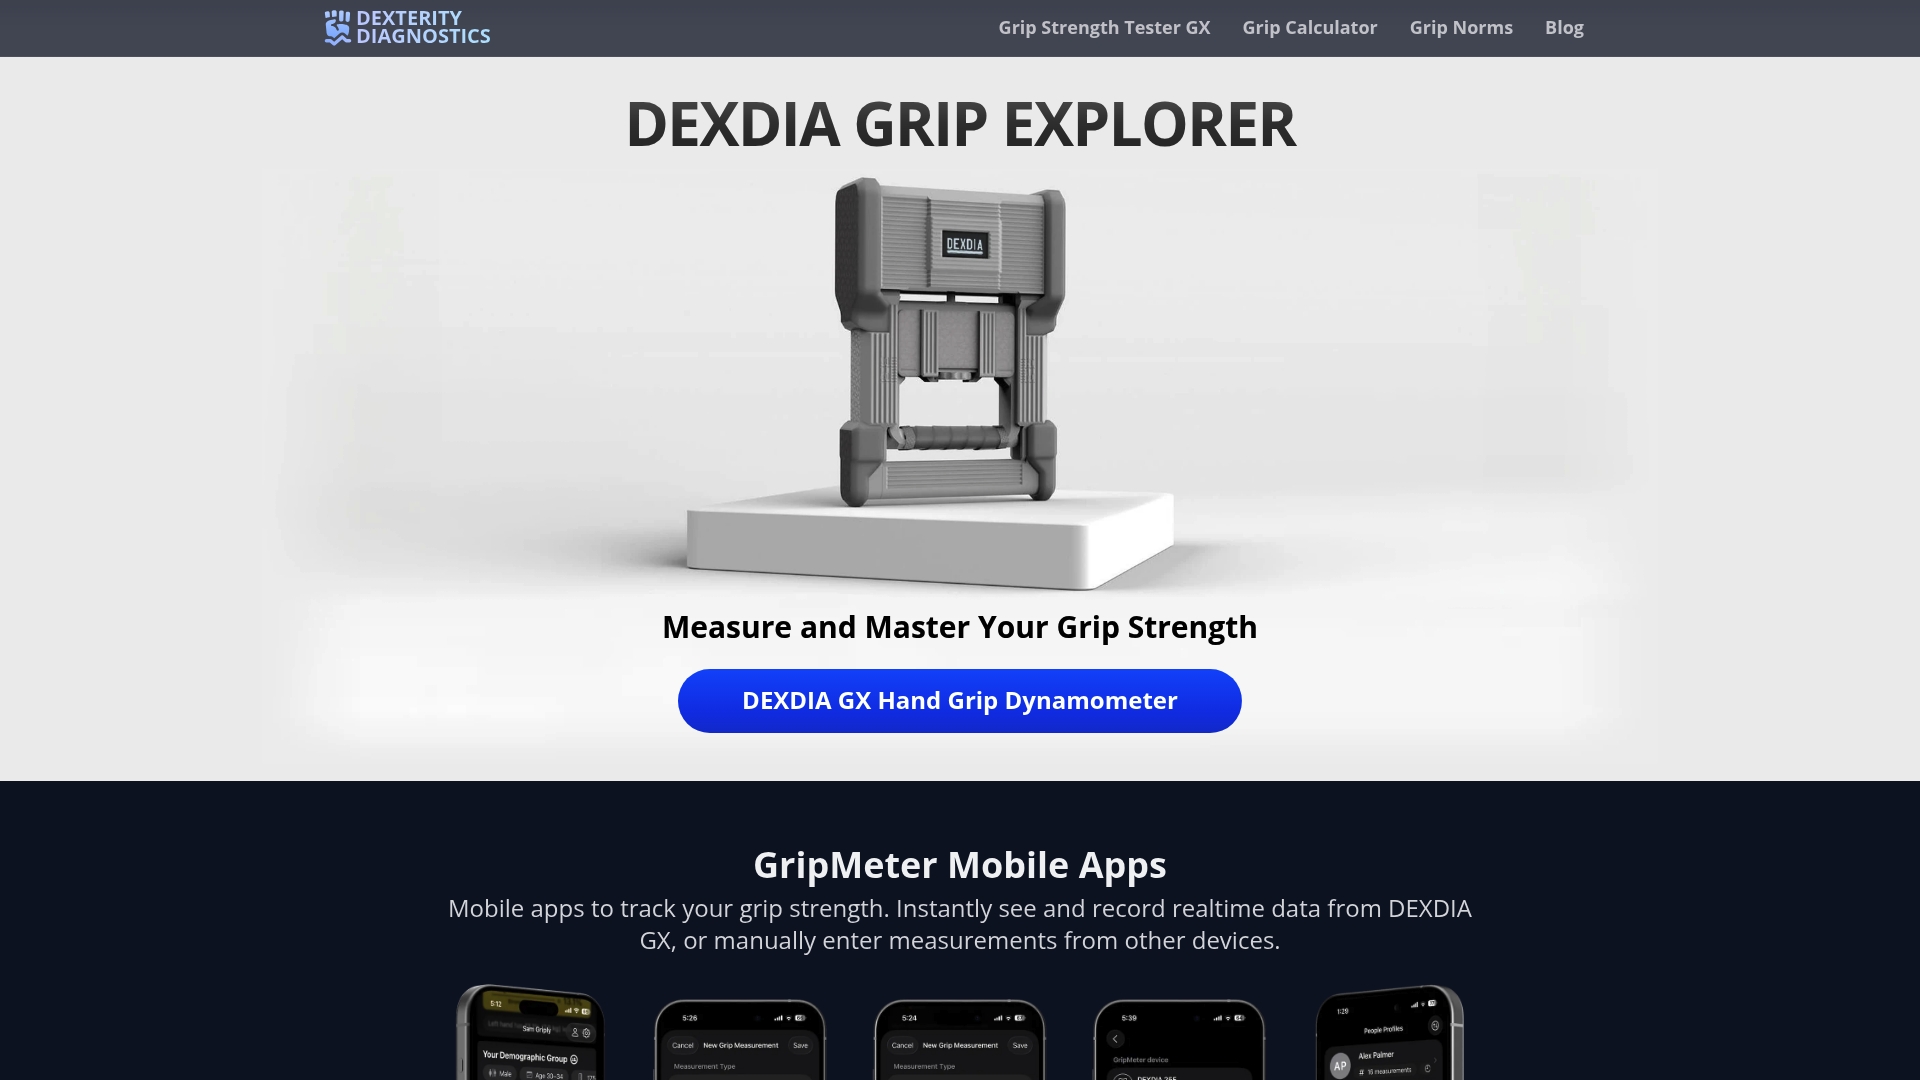
Where traditional dynamometers require manual transcription, separate spreadsheet calculations, and a printed norm table, the DEXDIA GX consolidates the entire workflow. Protocol templates built into the app enforce the standing, 90° elbow, three-trial standard described throughout this guide. The calculator normalizes results against Wang 2018-type U.S. norms and flags scores relative to EWGSOP2 thresholds, so clinicians spend time on clinical decisions rather than arithmetic. Exportable PDF reports include device model, protocol metadata, and normative reference, satisfying the documentation requirements that make serial comparisons valid.
For practitioners who want to explore the normative data before purchasing hardware, the Grip Strength Norms by Age and Height page provides downloadable reference charts at no cost. To run a percentile calculation on an existing reading, the Grip Strength Calculator is available as a standalone web tool. For those ready to standardize their assessment protocol with a validated device, the DEXDIA GX is the natural next step.
This article provides general educational information for health professionals and fitness practitioners. It is not a substitute for professional clinical judgment. Confirm current clinical guidelines and normative references with primary sources or a qualified clinician before applying them to individual patient care.
Useful sources and further reading
The following peer-reviewed studies, clinical resources, and Dexdia reference pages support the evidence presented in this guide.
Primary research and clinical references
- Lee et al. (2020). Measurement and Interpretation of Handgrip Strength for Research on Sarcopenia and Osteoporosis. PMC7297622. Systematic review covering EWGSOP2 cut-points, device considerations, and population-specific norms.
- International norms for adult handgrip strength: A systematic review (2.4M adults, 69 countries). PMC11863340. Pooled sex- and age-specific norms for absolute and body-size-normalized grip strength.
- Hand grip strength as a proposed new vital sign of health. PMC10777545. Narrative review on grip strength as a low-cost prognostic biomarker for primary care screening.
- Reference values for handgrip strength in Europe (SHARE analysis). Springer, 2025. European percentile bands by age and sex; documents standing vs. seated differences and regional gradients.
- Grip strength: why it matters. Cleveland Clinic / Dr. Hashmi. Clinical overview of grip strength's prognostic associations and biomarker testing recommendations.
- Why Is Grip Strength Important? What It Is and How to Measure It. WebMD. Consumer-facing measurement summary reinforcing standardized protocol guidance.
- Wang et al. (2018). Normative reference values for grip strength in U.S. adults ages 18–85. Journal of Bone Metabolism and related U.S. clinical literature. (Consult PubMed for the full citation and access.)
Dexdia clinical tools and resources
- Grip Strength Calculator — Convert raw readings to percentiles, symmetry ratios, and MDC flags.
- Grip Strength Norms by Age and Height — Downloadable height-adjusted normative charts for U.S. clinical use.
- Printable Grip Strength Norms (PDF) — Reference sheets for paper-based records and patient handouts.
- DEXDIA GX Grip Strength Tester — Bluetooth dynamometer product page with protocol specifications.
- Can grip strength predict health? — Evidence summary on chronic disease associations.
- How to determine grip strength? — Practical measurement guidance for clinicians and trainers.
- What does grip strength help with? Benefits in 2026. — Consumer-facing overview of grip strength benefits and training relevance.