
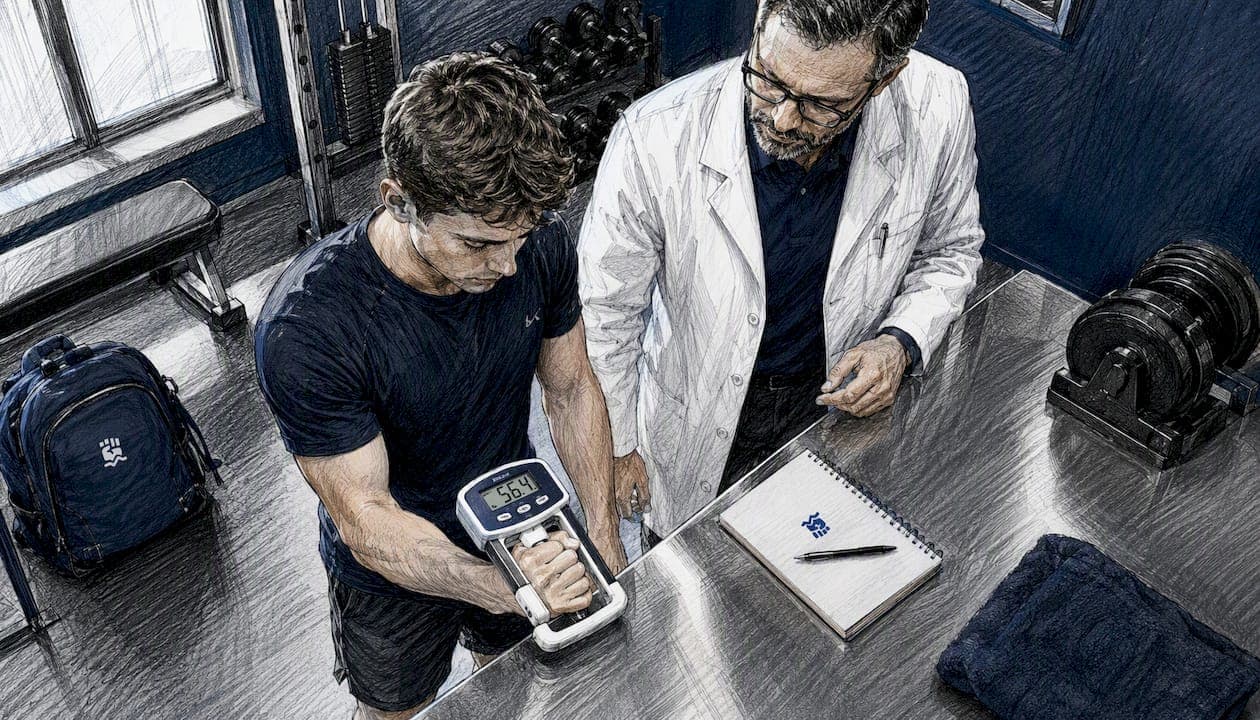
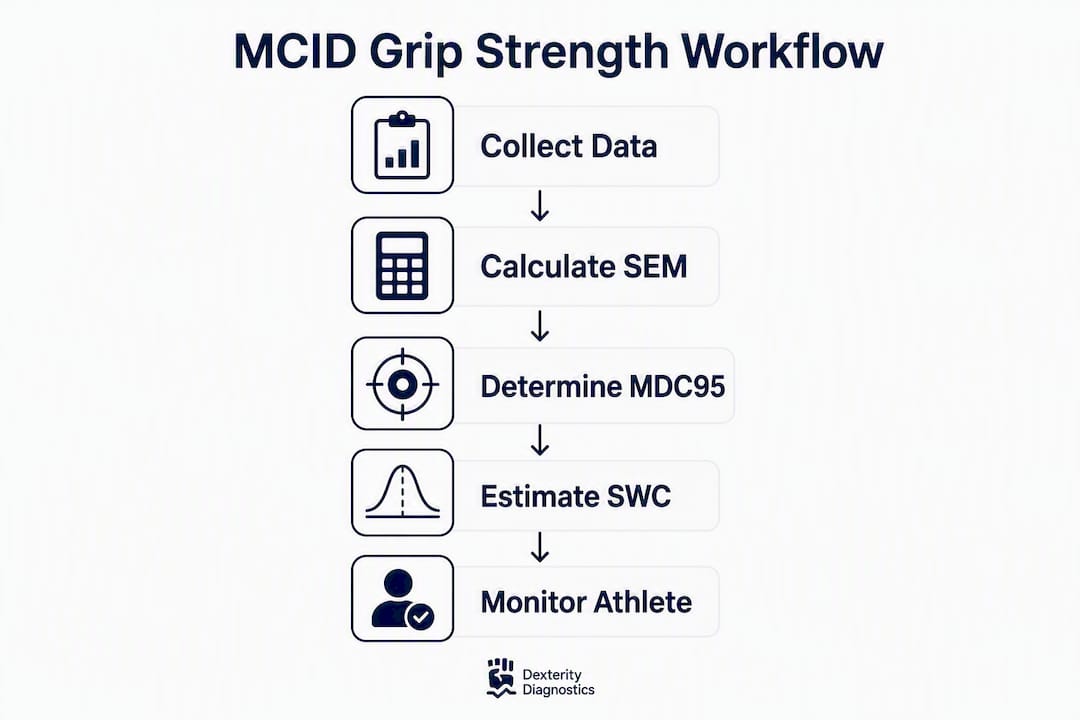
For sports performance monitoring, the minimal important change in grip strength is the smallest shift in dynamometer output that a coach should treat as real rather than random measurement noise. The standard approach: compute the Standard Error of Measurement (SEM) and MDC95 from your athlete's baseline data, compare any observed change to both the MDC95 and a Smallest Worthwhile Change (SWC) anchored to that individual's baseline standard deviation, and act when the change clears both boundaries. A side-to-side asymmetry exceeding 10% is a practical red flag worth flagging immediately. The DEXDIA GX dynamometer and the Dexdia Grip Strength Calculator automate these computations so coaches can focus on decisions rather than spreadsheets.
Note: this article covers athlete-specific monitoring thresholds for sports performance. It is not about clinical MCID values used in patient rehabilitation research, which address a different question for a different audience.
Table of Contents
- What does MCID for grip strength mean in sports performance?
- How to collect reliable grip-strength measures
- How to calculate SEM, MDC95, and SWC for an individual athlete
- How to interpret changes and make practical decisions
- Building a reliable baseline and monitoring schedule
- How Dexdia tools automate the MCID workflow
- Key Takeaways
- A note on grip-strength monitoring philosophy
- The DEXDIA GX makes this workflow practical for any team
- Useful sources
What does MCID for grip strength mean in sports performance?
In clinical research, MCID describes the smallest change a patient notices as meaningful. In sports monitoring, the equivalent concept is the minimal important change anchored to an individual athlete's baseline variability. Grip strength is a fast, objective measure of neuromuscular function useful for tracking fatigue, recovery, and return-to-play readiness. Persistent drops from baseline can indicate incomplete recovery.
The concept matters most in sports where the hand is the primary force-control point. Bibliometric evidence confirms that grip strength relates directly to throwing velocity, racket control, and climbing force application, making it a practical monitoring biomarker in baseball, tennis, climbing, and grappling. In those contexts, a meaningful change is not a fixed kilogram value borrowed from a population study. It is a threshold computed from the athlete's own data.
Grip-strength declines and asymmetry can appear before athletes report pain, making proactive monitoring more useful than waiting for symptoms. That early-warning property is precisely why athlete-specific thresholds matter: generic cutoffs routinely misclassify normal biological noise as a true signal, or miss a genuine decline because the threshold is set too high.
How to collect reliable grip-strength measures
Reliable data is the prerequisite for any meaningful threshold calculation. Variability introduced by inconsistent protocol inflates your SEM and widens your MDC95, making it harder to detect real change.
Pre-test controls to standardize:
- Test at the same time of day each session. Grip strength varies across the day, typically peaking in the late morning to early afternoon.
- Record recent training load and athlete RPE before each session. A session following a heavy training day is not comparable to a rested baseline.
- Note hydration status, caffeine intake, and sleep quality as potential confounders.
- Use verbatim instructions every session: "Squeeze as hard as possible for 3–5 seconds."
Physical setup:
- Calibrate the DEXDIA GX before each testing block. Confirm the correct grip size is selected for each athlete; an ill-fitting handle reduces reproducibility.
- Standard position is seated, arm at side, elbow at 90°. Standing tests produce approximately 2% higher readings than seated side-position tests. Overhead testing is informative for overhead athletes such as pitchers and volleyball players. Whichever position you choose, keep it identical across all sessions for that athlete.
Trial structure:
- Perform 2–3 maximal efforts per hand with 60 seconds of rest between trials.
- Test both hands in the same session. Standardize the order (dominant first or non-dominant first) and keep it consistent.
- Use the average of 2–3 trials rather than the single best effort for trend monitoring. The best-trial approach is appropriate for normative comparisons; the average is more stable for detecting longitudinal change.
Session metadata to record: device ID, grip size setting, tester name, time of day, athlete RPE, recent training load, hand dominance, and current injury status.
Pro Tip: Averaging 2–3 maximal 3–5 second efforts per hand reduces random trial-to-trial variability. Identical instructions and setup across sessions are as important as the device itself.
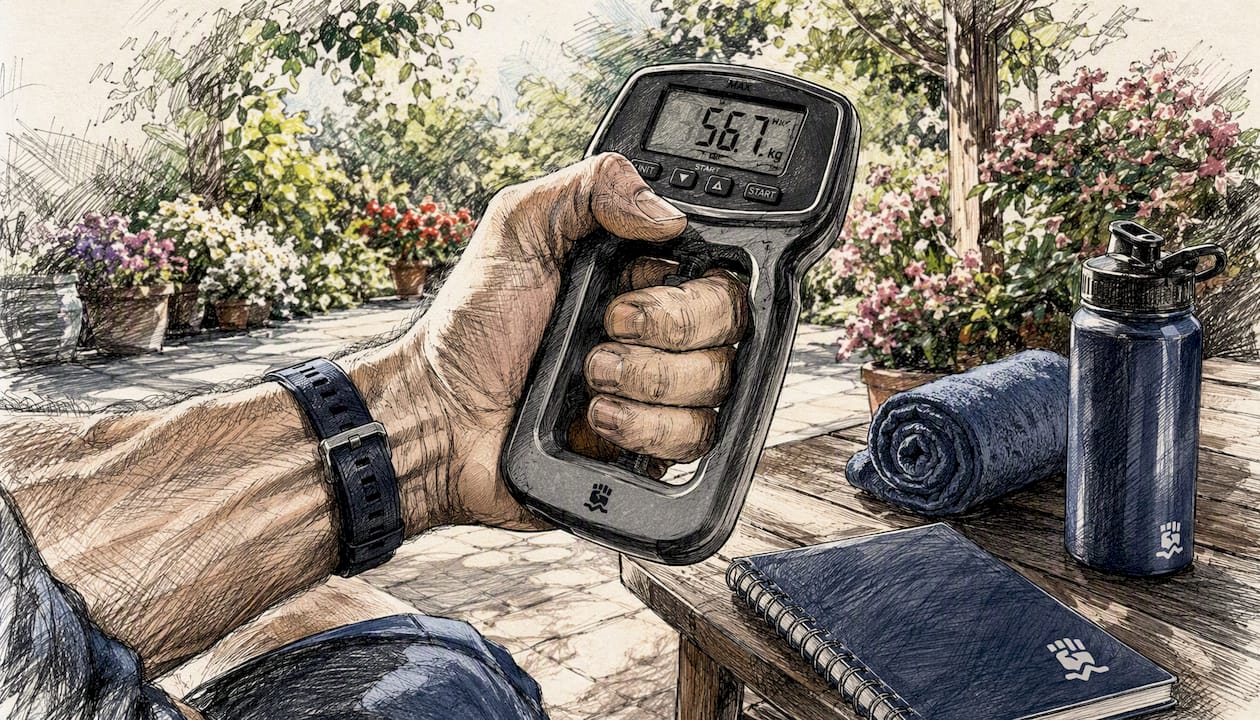
For guidance on when to schedule grip testing relative to training and competition, Dexdia's protocol notes are a practical starting point.
How to calculate SEM, MDC95, and SWC for an individual athlete
These three values form the calculation core of any athlete-specific grip strength MCID workflow.
The formulas
SEM (Standard Error of Measurement) quantifies measurement noise from a single session:
SEM = SD × √(1 − ICC) where SD is the standard deviation of the athlete's baseline scores and ICC is the intraclass correlation coefficient from test-retest reliability data.
MDC95 sets a 95% confidence boundary. A change must exceed this value to be considered real rather than measurement error:
MDC95 = SEM × 1.96 × √2
SWC (Smallest Worthwhile Change) anchors the threshold to the athlete's own performance variability. The distribution-based rule of thumb uses 0.2 × SD of baseline scores, borrowed from Cohen's small-effect-size convention. Monitoring literature recommends triangulating SWC with SEM and MDC values rather than relying on any single threshold.
Worked example
| Input | Value |
|---|---|
| MDC95 = SEM × 1.96 × √2 | 2.35 kg |
| SWC = 0.2 × — | 0.60 kg |
A change of 2.35 kg or more clears measurement noise at the 95% level. A change of 0.60 kg is the smallest shift worth monitoring as a performance signal. In practice, treat a change that exceeds MDC95 as confirmed real change; treat a change between SWC and MDC95 as a trend worth watching across the next 1–2 sessions.
When athlete-specific ICC data is unavailable, collect multiple baseline sessions and estimate SEMwithin from within-subject repeated measures rather than borrowing population ICCs. Population values may not reflect your athlete's true variability.
Pro Tip: Run 3 baseline sessions across 1–2 weeks under stable training conditions before computing SEM. Two sessions is the minimum; three gives a more stable SD estimate.
The Dexdia Grip Strength Calculator accepts SD and ICC inputs and returns SEM, MDC95, and SWC automatically, along with left/right symmetry percentages.
How to interpret changes and make practical decisions
Once you have computed MDC95 and SWC, the decision logic is straightforward.
- Change < SWC: Normal biological noise. No action needed. Continue scheduled monitoring.
- Change ≥ SWC but < MDC95: Potential trend. Schedule a confirmatory re-test within 48–72 hours before adjusting training load.
- Change ≥ MDC95 (single session): Likely real change. Investigate contextual factors (fatigue, sleep, recent load). Modify training if the context supports it.
- Change ≥ MDC95 on 2 consecutive sessions: Strong evidence of a meaningful shift. Reduce load, flag for clinical review if asymmetry is also elevated.
- Asymmetry > 10%: Practical red flag. Studies link asymmetries greater than 10–15% to higher rates of wrist, elbow, and shoulder injury in baseball and tennis. Investigate before the next high-load session.
- Asymmetry > 15%: Elevated concern. Refer to a licensed clinician if the asymmetry is new, persistent, or accompanied by any reported discomfort.
Symmetry formula: Symmetry % = (weaker hand ÷ stronger hand) × 100. A score below 90% (i.e., >10% gap) triggers step 5 above.
Combining both signals strengthens the decision. A side-to-side change that exceeds MDC95 and creates asymmetry above 10% is stronger evidence of meaningful change than either signal alone.
Contextual modifiers that can produce false positives: high training load in the preceding 24–48 hours, early-morning testing, poor sleep, dehydration, and low motivation. When any of these are present, schedule a confirmatory test rather than acting on a single value. Understanding grip strength as a proxy for neuromuscular readiness helps contextualize these fluctuations within the broader picture of athlete preparedness.
Building a reliable baseline and monitoring schedule
A stable baseline is the foundation of any meaningful MCID calculation. Without it, your SEM estimate is unreliable and your thresholds will be either too sensitive or too conservative.
Baseline construction: Run 3–5 sessions spread over 1–2 weeks under stable training conditions. Avoid testing during a taper, a high-volume block, or immediately after competition. Use these sessions to compute SDwithin and SEMwithin for each athlete.
| Phase | Frequency | Purpose |
|---|---|---|
| Baseline (weeks 1–2) | 3–5 sessions | Establish SD, SEM, MDC95, SWC |
| In-season weekly | Once per week | Trend monitoring, load management |
| Pre/post-competition | 24h before, 24h after | Fatigue tracking, recovery confirmation |
| Return-to-play | Every 48h | Clearance decision support |
Data handling: Use a rolling average of the last 3 sessions as your reference baseline during the season. Flag any single session that deviates by more than MDC95 as a potential alert, but wait for a second consecutive deviation before changing the training plan. Store all session metadata alongside the force values so you can distinguish a fatigue-driven drop from a true performance decline.
Pro Tip: Rolling-average baselines work well for in-season trend monitoring. Single-session alerts are best used for early-warning detection, not immediate load decisions.
How Dexdia tools automate the MCID workflow
The DEXDIA GX and Dexdia software reduce the manual calculation burden at every step of the workflow described above.
Step-by-step workflow with Dexdia:
- Pair the DEXDIA GX via Bluetooth to the Dexdia app before the session.
- Enter session metadata (athlete profile, grip size, tester, time of day).
- Complete 2–3 maximal trials per hand following the standardized protocol.
- Data syncs automatically to the athlete's profile in the app.
- The app computes SEM, MDC95, SWC (distribution-based), and left/right symmetry percentages from accumulated baseline sessions.
- Trend visualizations flag sessions that exceed MDC95 or cross the 10% asymmetry threshold.
What Dexdia computes automatically: ICC estimation from multiple baseline sessions, SEM, MDC95, SWC (0.2 × SD option), and symmetry percentage for each session.
The DEXDIA GX is built for field reliability: consistent sensor resolution, a range of interchangeable grip sizes, and a calibration workflow that takes under two minutes. Normative comparisons draw from Dexdia's grip strength norms by age and height, giving coaches a population reference point alongside the athlete's own longitudinal data.
Pro Tip: Export raw trial-level data from the Dexdia app for offline reliability analysis or to apply alternative SWC anchors, such as sport-specific performance thresholds rather than the 0.2 × SD default.
For teams evaluating device options, Dexdia's digital dynamometer buying guide covers specification considerations relevant to measurement fidelity.
Key Takeaways
A meaningful change in grip strength for sports monitoring requires an athlete-specific threshold computed from SEM, MDC95, and SWC, not a fixed population cutoff.
| Point | Details |
|---|---|
| Build a proper baseline first | Run 3–5 sessions over 1–2 weeks to compute a stable SDwithin and SEMwithin for each athlete. |
| Use MDC95 as your noise filter | MDC95 = SEM × 1.96 × √2; only changes exceeding this value are confirmed real at the 95% level. |
| Flag asymmetry above 10% | Side-to-side asymmetry greater than 10% is a practical red flag linked to upper-limb injury risk. |
| Combine signals before acting | A change that exceeds MDC95 and creates asymmetry above 10% is stronger evidence than either signal alone. |
| Dexdia automates the workflow | The DEXDIA GX and Dexdia Grip Strength Calculator compute SEM, MDC95, SWC, and symmetry automatically from accumulated session data. |
A note on grip-strength monitoring philosophy
Grip strength monitoring works best when it is treated as one signal within a broader readiness picture, not as a standalone clearance test. At Dexdia, the approach we recommend combines grip data with other objective and subjective markers: heart rate variability, sleep quality, and athlete-reported RPE. Each of these measures a different aspect of readiness, and their convergence or divergence tells a more complete story than any single metric.
The most common mistake in applied monitoring is acting on a single data point. A one-off drop in grip force after a hard training week is expected physiology. A persistent decline across two or more sessions, especially when combined with elevated asymmetry and poor sleep scores, is a different signal entirely. The formulas in this article give you the statistical boundary to tell those two situations apart.
Grip strength is increasingly recognized as an early-warning biomarker in sports science, with publication growth accelerating since 2019 across sport-science journals. The evidence base for using it in athlete monitoring is stronger now than it has ever been. The practical gap is not in the research; it is in the calculation workflow. That is the gap Dexdia tools are built to close.
The DEXDIA GX makes this workflow practical for any team
Calculating SEM, MDC95, and SWC manually for a roster of athletes is time-consuming. The DEXDIA GX grip strength tester and the Dexdia Grip Strength Calculator handle those computations automatically, so coaches spend time on decisions rather than formulas.
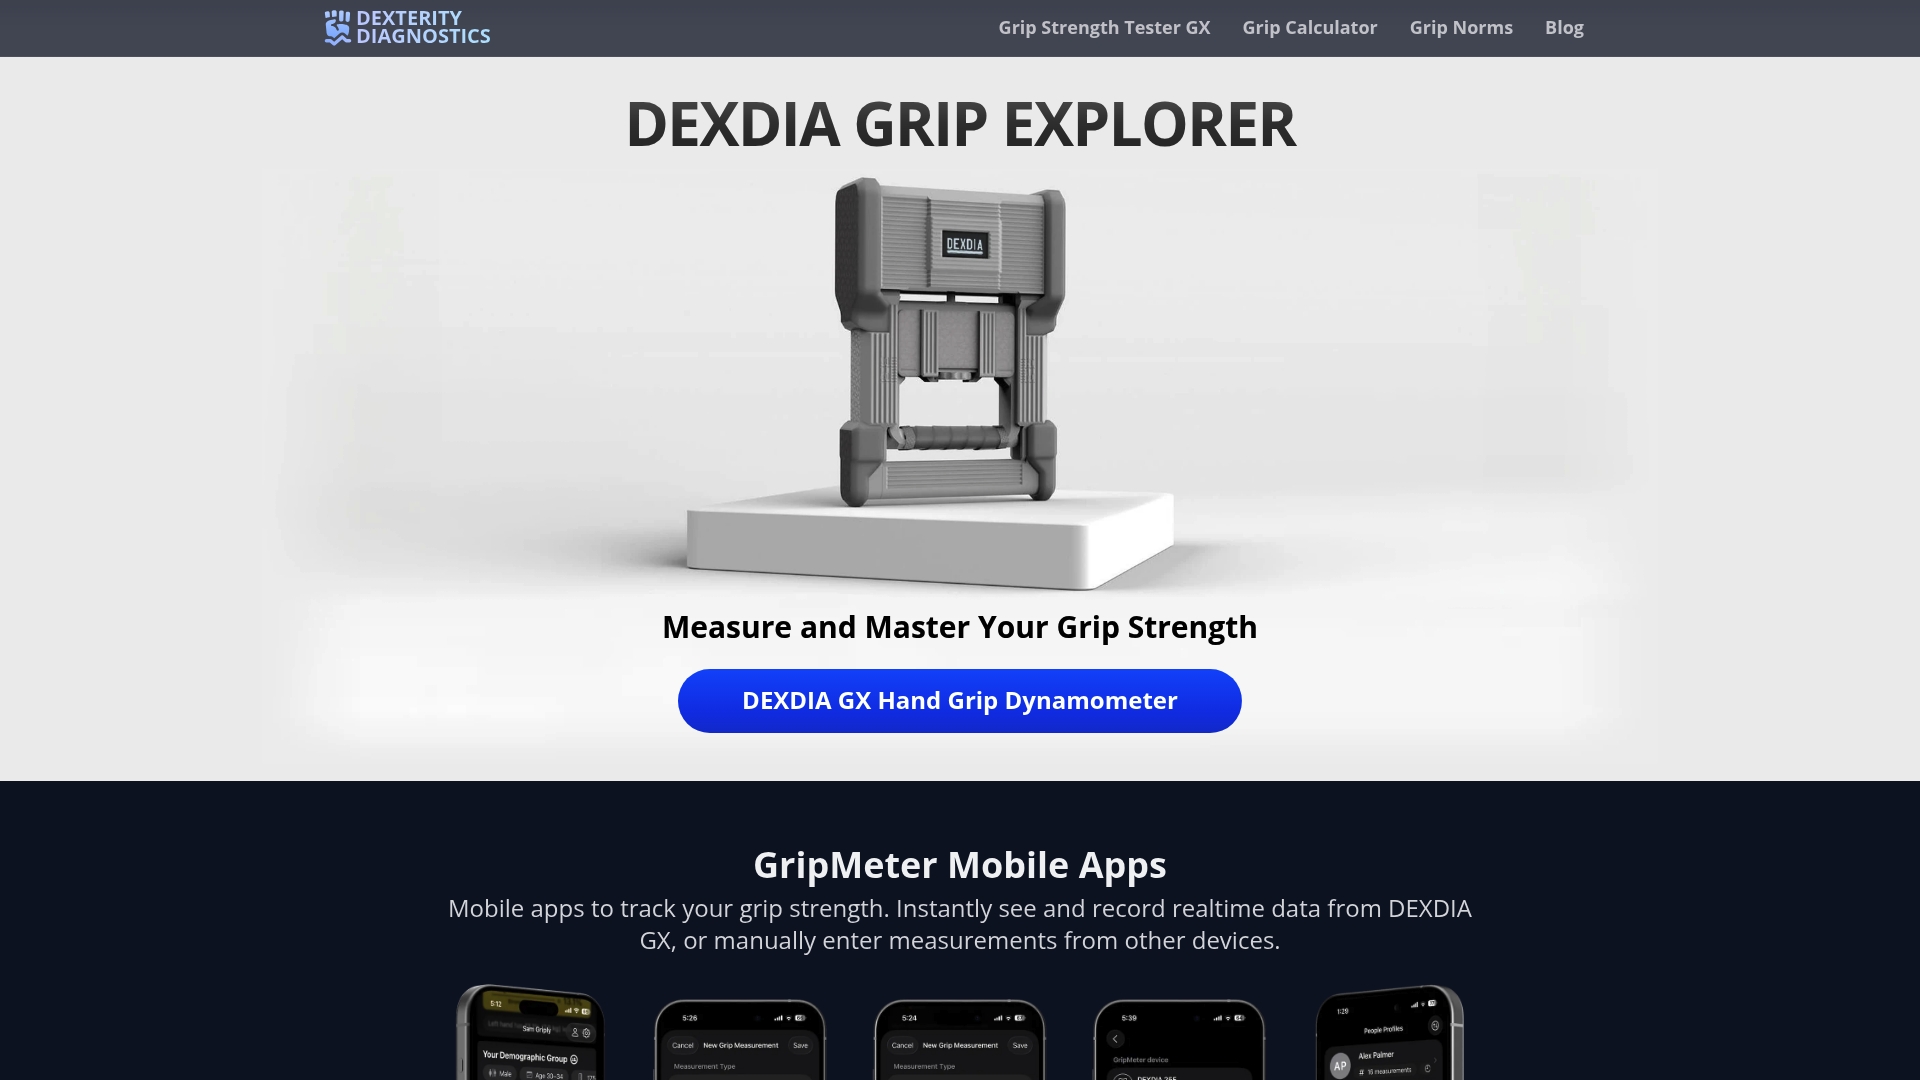
The DEXDIA GX connects via Bluetooth to the Dexdia app, stores longitudinal athlete profiles, flags sessions that exceed MDC95 or cross the 10% asymmetry threshold, and exports data for deeper analysis. The Grip Strength Calculator lets you enter SD and ICC values and receive SEM, MDC95, and SWC outputs in seconds, with normative comparisons drawn from Dexdia's age- and height-referenced dataset.
This is a sports-performance monitoring workflow. It is not a medical diagnostic tool. For athletes presenting with pain, acute injury, or clinical concerns, refer to a licensed clinician. Dexdia tools support performance optimization decisions made by coaches and athletes, not medical diagnosis.
Visit the DEXDIA GX product page to review device specifications or place an order, or open the Grip Strength Calculator now to run your first athlete-specific MDC95 computation.
Useful sources
Dexdia resources:
- Grip Strength Calculator — compute SEM, MDC95, SWC, and symmetry for individual athletes
- DEXDIA GX Grip Strength Tester — device specifications and purchase information
- Grip Strength Norms by Age & Height — normative reference data for SWC anchoring and population comparisons
External references:
- Grip Strength in Sports Medicine: Use Cases and Recommendations — practical monitoring rationale, asymmetry thresholds, and early-warning evidence
- Mapping Handgrip Strength Research in Sports Performance: A Bibliometric Review — evidence base for sport-specific grip monitoring
- Using Velocity Based Training to Monitor Training Adaptation — SEM, MDC95, and SWC formulas with monitoring-framework context
- Grip Strength Testing Protocols with Normative Data — position-specific protocol guidance including standing vs. seated differences
- A Pilot Study Using Sideline Hand-Grip Dynamometry in a High School Baseball Season — feasibility evidence for on-site seasonal monitoring