
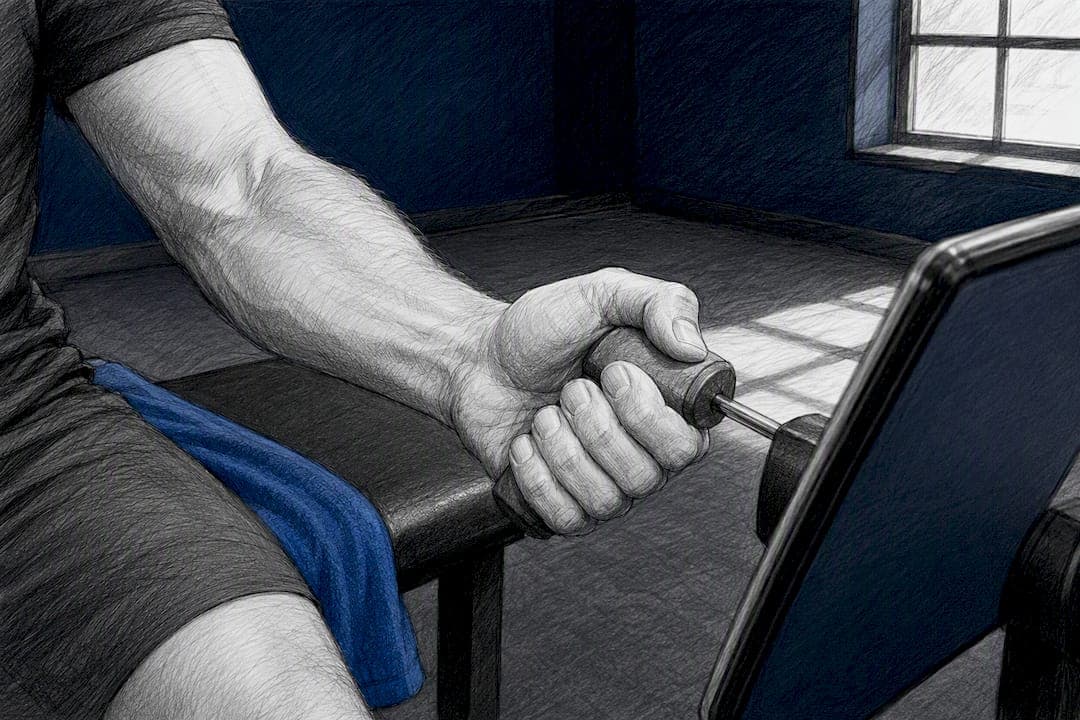
Handheld dynamometry combined with app-based tracking gives coaches and clinicians an objective, repeatable way to baseline, monitor, and act on athletes' grip strength and symmetry. This is a performance and recovery tool, not a diagnostic one. Used consistently, it supports four practical outcomes: establishing a baseline, catching left-right symmetry deficits, tracking progress across a training block, and flagging fatigue before it becomes an injury. Dexdia builds its GX dynamometer and companion app specifically around this workflow.
TL;DR:
- Consistent use of handheld dynamometry allows coaches to reliably track an athlete's grip strength trends, symmetry, and fatigue levels over time.
- Calibration, handle fit, and standardized testing protocols are essential to ensure repeatable and comparable results during each session.
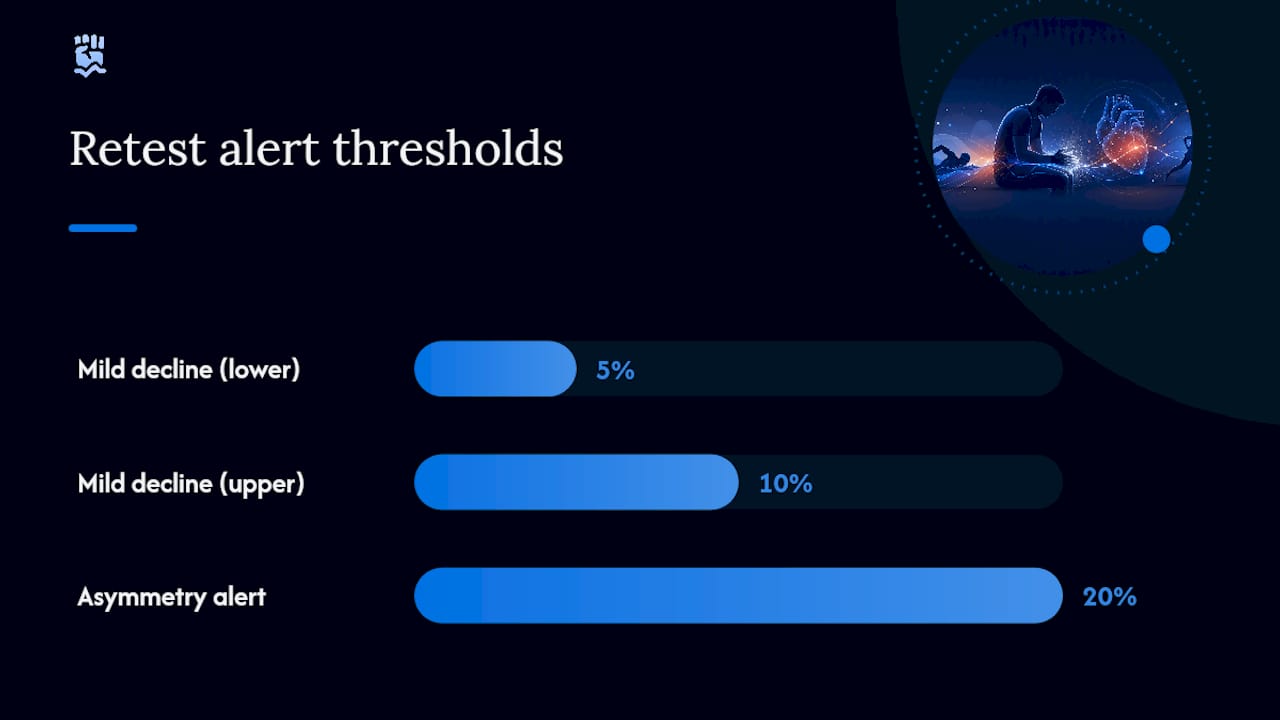
- A 5 to 10% drop from an athlete’s baseline may indicate fatigue, while a decline over 20% or asymmetry could signal potential injury risk.
- Testing frequency should match training goals, with baseline assessments, periodic progress checks, and weekly or daily monitoring for readiness.
- The Dexdia GX device automates data collection, trend analysis, and symmetry calculations, reducing manual effort and improving decision-making accuracy.
Table of Contents
- How Grip Strength Connects to Heart Health and Athletic Monitoring
- How Do You Measure Grip Strength Reliably?
- What Do the Numbers Actually Mean?
- How Often Should You Retest for Training Decisions?
- Field and Clinic Testing Scripts That Actually Get Used
- What Coaches Consistently Get Wrong About Grip Data
- Track Grip Strength With Confidence Using the DEXDIA GX
- Sources
How Grip Strength Connects to Heart Health and Athletic Monitoring
Grip strength gets discussed in two very different contexts, and mixing them up wastes a coach's time. One is epidemiological research linking grip to long-term cardiovascular outcomes across large populations. The other, the one that matters on a training floor or in a rehab clinic, treats hand grip strength as a proxy for whole-body neuromuscular readiness and upper-body strength qualities that support cardiovascular training capacity.
For practitioners, grip strength testing tells you something faster and cheaper than most other performance markers: whether an athlete's nervous system is producing force normally today, compared to their own baseline. A grip test takes 90 seconds. A force plate session or a lab-grade VO2 assessment does not. That accessibility is why grip dynamometry shows up in strength and conditioning programs, physical therapy clinics, and return-to-play protocols as a repeatable checkpoint, not a one-time score.
The standard industry term for this measurement is isometric handgrip dynamometry, and the tool that produces it is a handheld or hand grip dynamometer. Whether you call it a grip test or a dynamometer reading, the value comes from doing it the same way every time.
How Do You Measure Grip Strength Reliably?
Reliability lives or dies in the setup. The NHANES handgrip protocol built its calibration and trial structure specifically to eliminate the variability that ruins comparisons across sessions.
- Calibrate first. Check the dynamometer against known weights before testing sessions, following the same quality-control approach CDC's NHANES protocol uses to validate readings.
- Fit the handle. Set the grip so the second finger joint sits near a 90-degree angle. Handle span matters more than most coaches assume. Research on crush-grip mechanics shows an "inverted U" relationship between span and force output, with peak output typically near 55 millimeters for most adult hands.
- Choose your position deliberately. The ASHT seated standard (shoulder adducted, elbow at 90 degrees, forearm neutral) is the reference position for clinical precision. A standing field variation works for large-group screens where speed matters more than absolute precision.
- Run the trial sequence. One practice trial, then multiple maximal efforts per hand, alternating sides, with adequate rest between trials on the same hand, mirrors NHANES quality-control timing.
- Record everything, not just the number. Log effort quality (maximal vs. questionable), dominant hand, and any deviation from the standard setup.
- Troubleshoot drift. If back-to-back sessions show unexplained jumps, recalibrate the device before assuming the athlete changed.
Pro Tip: Use the exact same verbal cue every single test ("squeeze as hard as you can, now") because inconsistent encouragement measurably shifts output, an effect documented in the NHANES protocol itself.
What Do the Numbers Actually Mean?
Raw scores mean little without context. Practitioner guidance consistently recommends using the mean of three trials per hand as the tracking number, while keeping the peak trial on file for motivational feedback and as a ceiling reference.
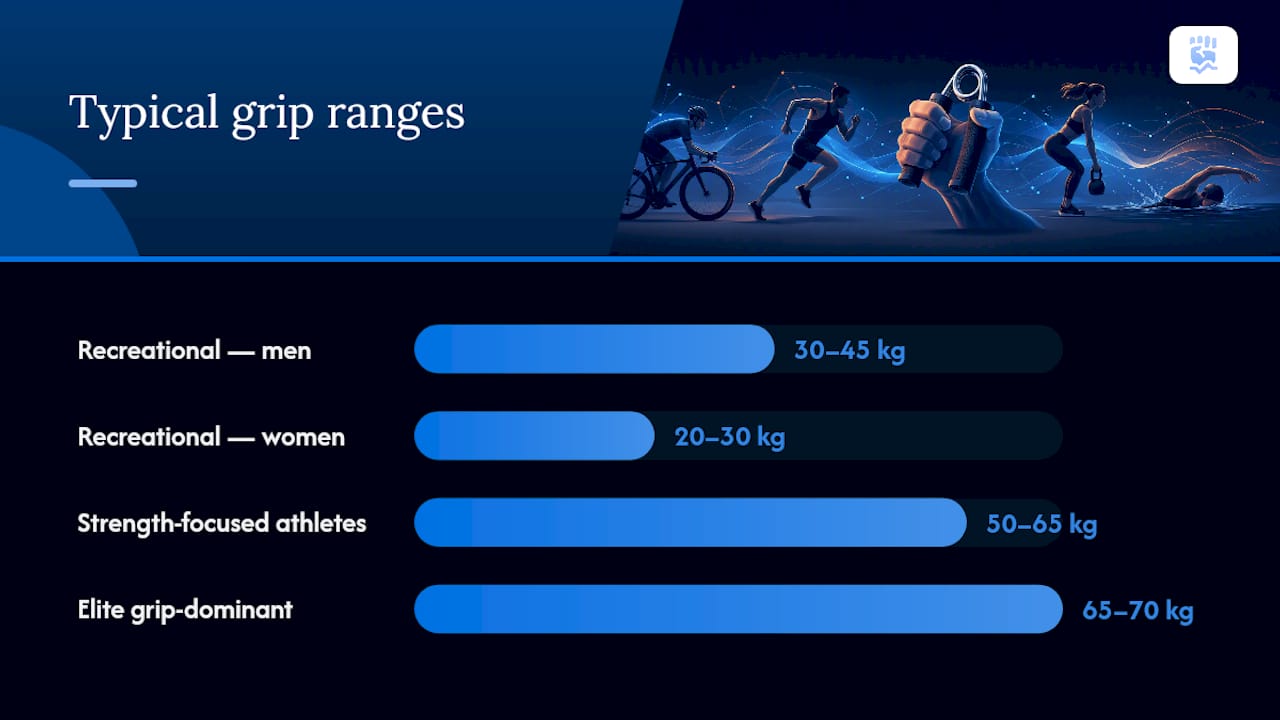
Normative bands vary by population, but rough working ranges help set expectations:
- Recreational athletes: wide variance, often 30 to 45 kg for men and 20 to 30 kg for women, depending on sport.
- Strength-focused athletes: commonly 50 to 65 kg, reflecting grip's role as a limiting factor in pulling and carrying work.
- Elite grip-dominant competitors (climbing, grappling, strongman): frequently exceed 65 to 70 kg, with less left-right variance than the general population.
Symmetry matters as much as absolute strength. A difference under 10 to 15% between hands is generally considered normal variation. Differences above a certain threshold should be investigated, particularly if it's new or paired with pain.
A useful benchmark: a 5 to 10% drop from an athlete's own baseline is a sensitive signal of accumulated fatigue, while focused grip training tends to produce a notable improvement over several weeks of focused training in athletes who hadn't trained grip directly before.
Watch for quality-control red flags too: erratic trial-to-trial swings, an athlete who visibly isn't giving full effort, or scores that contradict everything else you're seeing in training. Protocol drift is common across studies. A systematic review of grip strength research covering over three million participants found that looser control of testing variables tends to inflate values, which is exactly why sticking to one fixed setup matters more than chasing a "correct" absolute number.
How Often Should You Retest for Training Decisions?
A monitoring plan only works if the cadence matches the question you're asking.
- Baseline test at the start of a training block or upon athlete intake, using the full protocol.
- Retest periodically over a couple of months to track progress to track structural progress, matching the cadence practitioner guidance recommends for meaningful strength change.
- Weekly or daily mini-checks for programs monitoring daily readiness, particularly during high-load training blocks or return-to-play windows.
Short-term drops need context before they trigger a reaction. A single low reading after a heavy training week is expected. Cross-referencing grip data against HRV or a daily wellness questionnaire cuts down on false alarms, since grip alone can be affected by sleep, hydration, or a rough morning.
When the data does flag something real, the coaching response should be graded rather than reactive:
- Mild decline (5 to 10%): reduce accessory volume, keep the main lifts.
- Persistent decline or asymmetry over 20%: delay heavy pulling or gripping work and add targeted grip-specific accessory training.
- Pain plus asymmetry: refer out for a proper physical assessment rather than continuing to load through it.
Pro Tip: Set your app's alert threshold to a moderate fatigue band rather than a higher asymmetry band. By the time asymmetry crosses 20%, you've usually already missed several smaller warning signs.
A monitoring app earns its place by doing more than storing numbers. The most useful ones surface symmetry charts and trend lines automatically rather than forcing a coach to eyeball a spreadsheet, an approach that reduces interpretation error and speeds up decisions during a busy training week.
Field and Clinic Testing Scripts That Actually Get Used
Protocols only help if they survive contact with a real schedule. Two scripts cover most situations.
Field quick-check (standing, group setting):
- Set the handle to the athlete's second-knuckle fit.
- Cue with the same verbal script every time.
- Run one hand, log to the app, repeat on the other side.
- Flag anything outside the athlete's normal range for a follow-up seated test.
Clinic baseline or rehab follow-up (seated, ASHT protocol):
- Confirm calibration before the session starts.
- Seat the athlete per the ASHT standard: shoulder adducted, elbow at 90 degrees.
- Capture three maximal trials per hand with full rest intervals, alternating sides.
- Average both hands' trials and compare against the athlete's prior session.
Data-logging discipline separates useful longitudinal records from noise. Every entry should capture device model, handle setting, which hand is dominant, trial timestamps, and a short subjective note (sleep, soreness, recent training load). This level of detail matters more in rehab settings, where a structured record of pain and hand function helps a clinician decide whether to progress or hold a program.
Escalate to a full assessment when you see pain paired with a grip drop, asymmetry beyond 20% that persists across sessions, or repeated low-effort trials that don't match the athlete's training history.
What Coaches Consistently Get Wrong About Grip Data
Most teams that adopt grip testing treat the first session as the hard part and the tenth session as an afterthought. That's backwards. A single baseline number tells you almost nothing on its own. The value shows up in trial three, session six, week ten, when a pattern either confirms progress or reveals a problem before it turns into a torn flexor or a missed competition.
The bigger error is comparing an athlete's number against a population chart instead of against their own history. Normative bands are useful for a first conversation, but the number that actually drives a training decision is this week's reading against this athlete's own trend line, adjusted for symmetry and effort quality. Static, general population data can't tell a coach whether Tuesday's 8% drop is normal fatigue or the start of something worse.
Repeatability, symmetry math, and long-term trend visualization are exactly the pain points that manual testing with a stopwatch and a spreadsheet solves poorly. Neither decision came from a single number. Both came from consistent tracking over time.
— Dexdia Team
Track Grip Strength With Confidence Using the DEXDIA GX
Everything covered above, calibration, trial averaging, symmetry math, trend detection, is exactly what the DEXDIA GX and its companion app were built to automate. The Bluetooth-enabled dynamometer syncs each trial straight to your phone, calculates left-right symmetry automatically, and builds the trend charts coaches otherwise have to piece together by hand. Reports pull from research-backed norms, so you're comparing an athlete against relevant benchmarks instead of guessing.
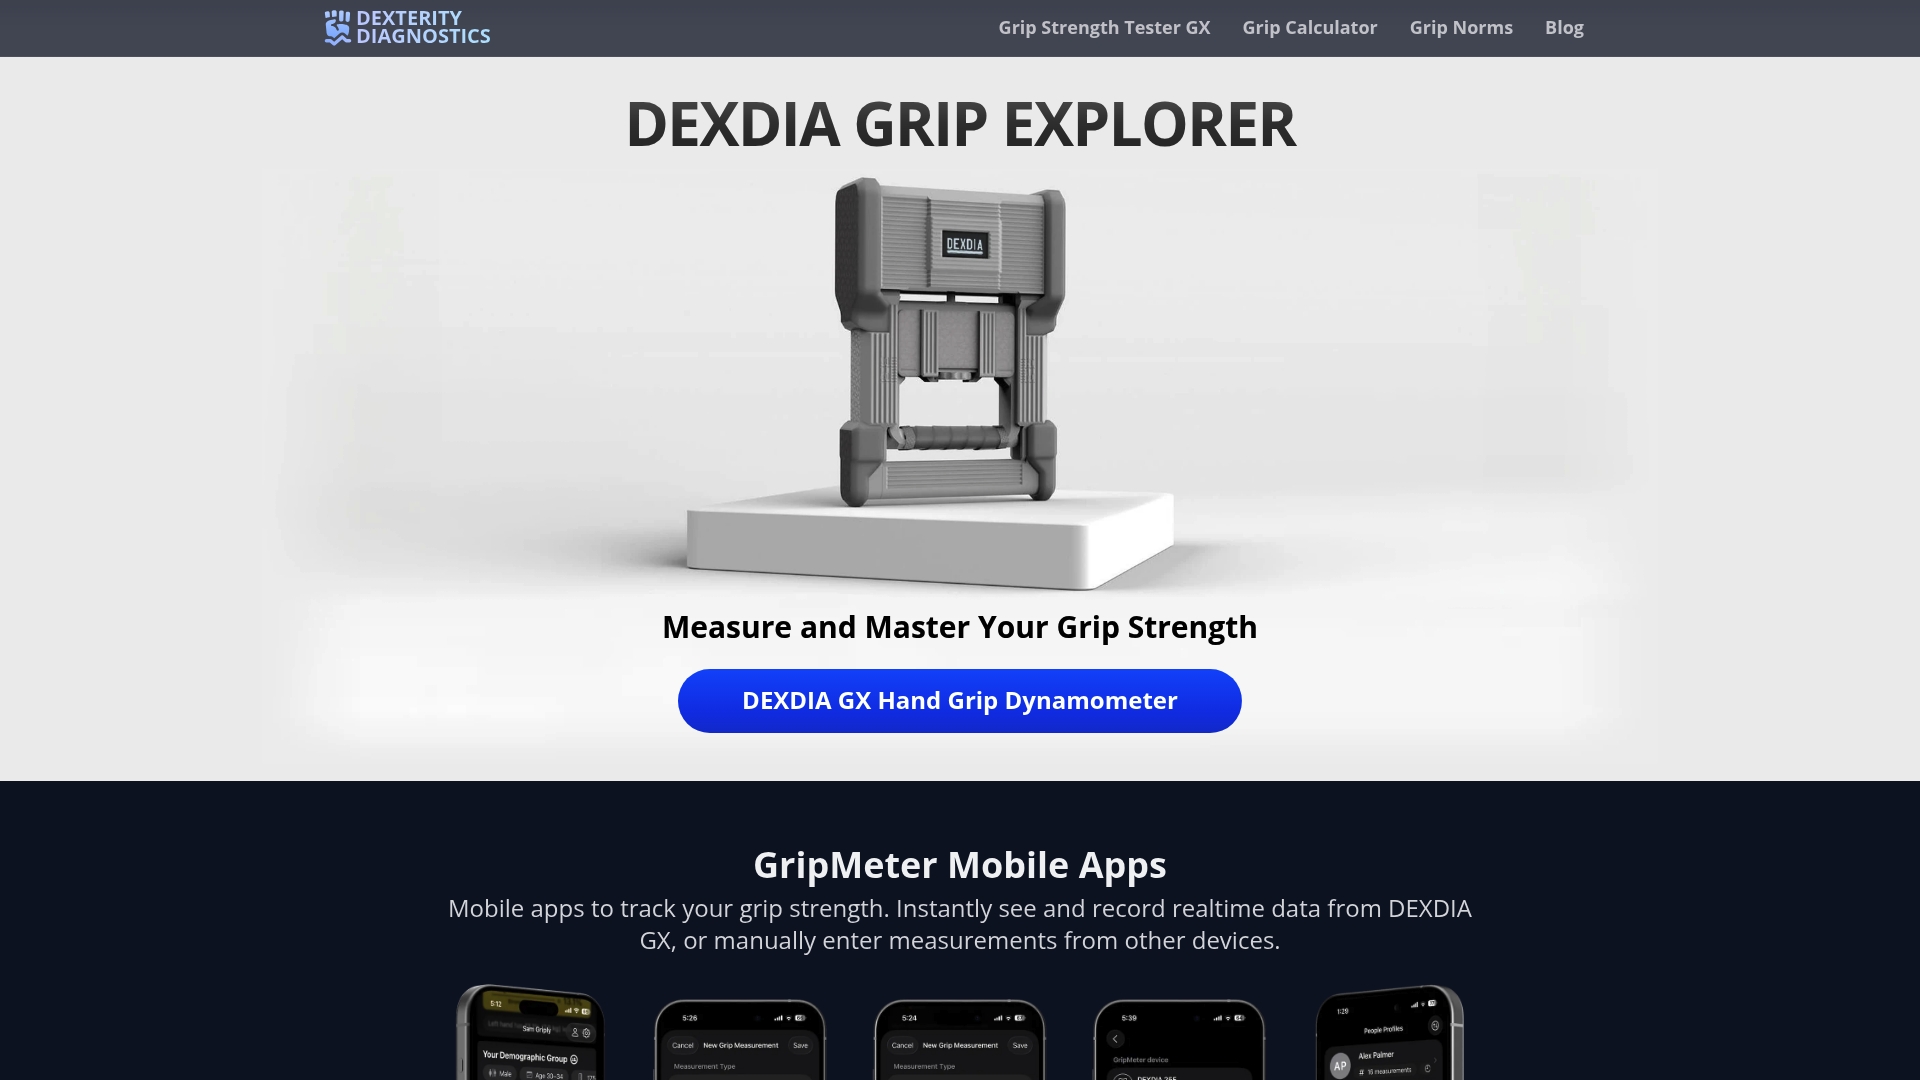
If you're not ready to commit to a device yet, run a current score through the Grip Strength Calculator to see how it stacks up against normative data for your athlete's profile. When you're ready to build a real monitoring system instead of a one-off test, the DEXDIA GX product page has the specs and ordering details to get a device into your hands this week.
Sources
- NHANES handgrip muscle strength protocol (CDC archive)
- Grip strength training: complete science-based guide — PoinT GO Research