
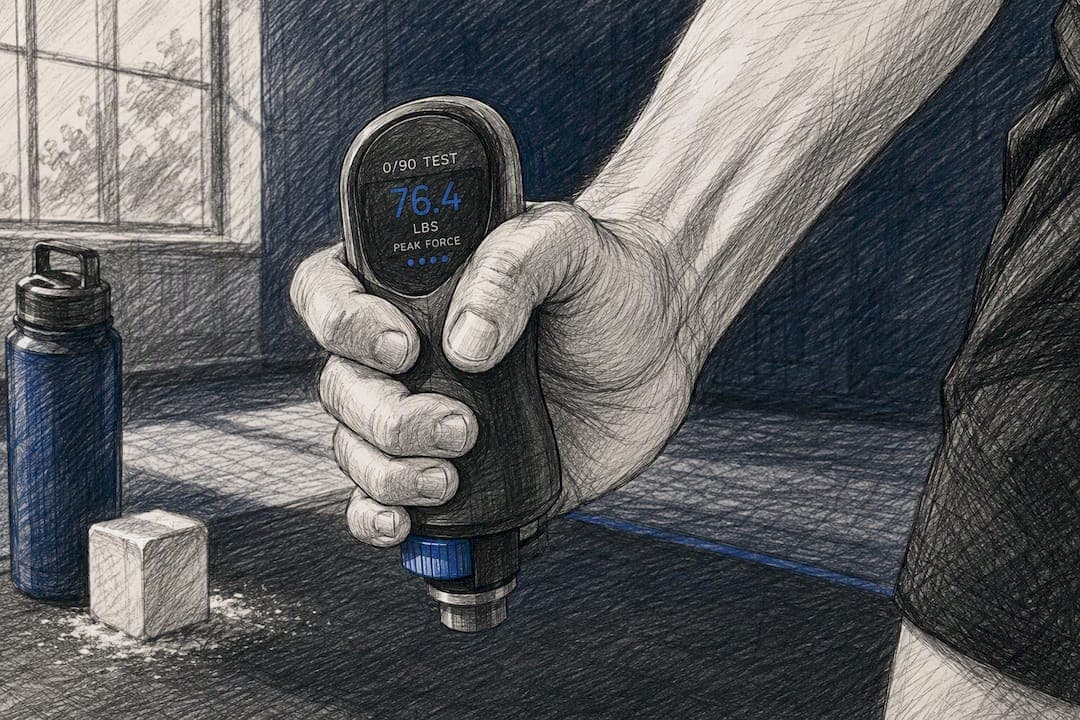
The single best baseball grip strength test uses a calibrated hydraulic or validated digital dynamometer, testing the 0/90 side position for position players and adding an overhead position for pitchers. Run three maximal squeezes per hand, 3 to 5 seconds each, with 30 seconds of rest between trials, and record the mean in kilograms. Compare that number to sport-specific norms, then treat any acute 5 to 10% drop from an athlete's own baseline as a signal to investigate workload before velocity or mechanics change.
TL;DR:
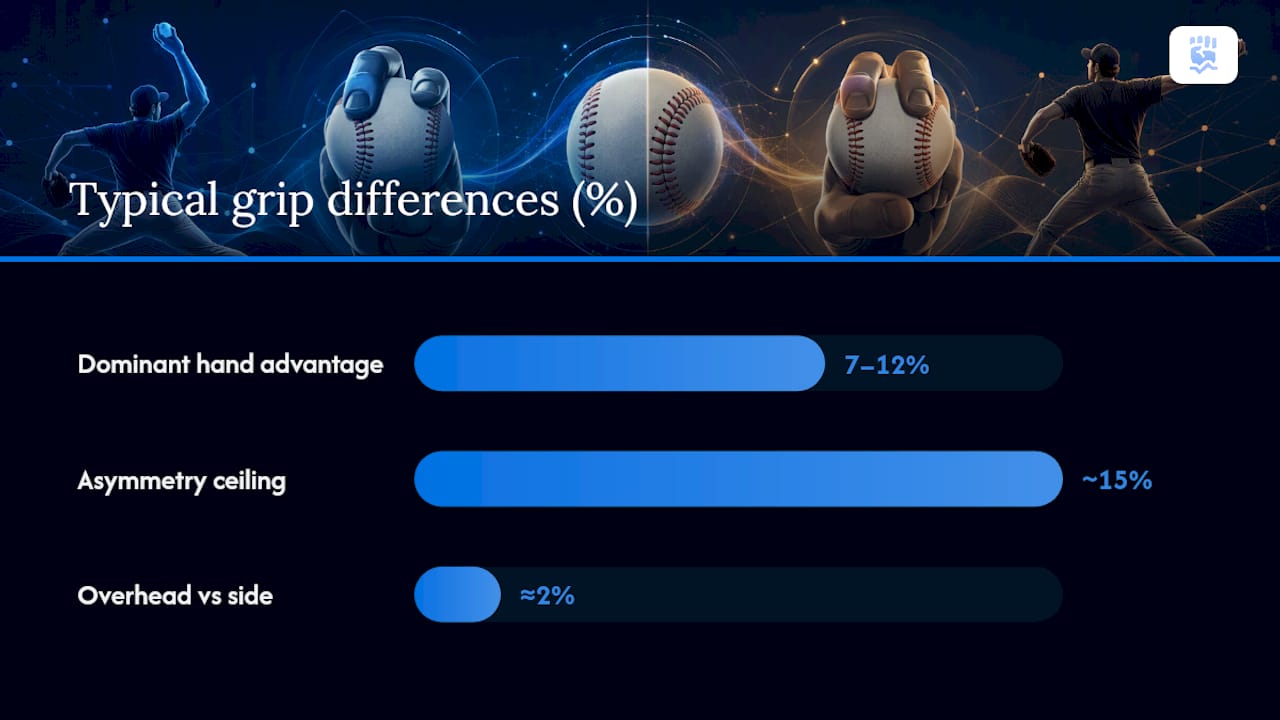
- Most players should expect their dominant grip strength to be 7 to 12% higher than the non-dominant hand, with asymmetries above 15% warranting further review.
- Overhead grip strength in healthy overhead athletes should be roughly 2% stronger than side grip; significant reversals signal potential issues.
- Regular testing with calibrated devices and a consistent protocol allows detection of a 5 to 10% drop below baseline, indicating possible fatigue or overload.
- Finger-specific tests, such as pinch and isolated finger strength assessments, can reveal fatigue missed by full-grip measurements, especially in pitchers.
- Using automated tools like Dexdia GX improves data accuracy, symmetry analysis, and benchmarking against baseball norms, making in-season monitoring more effective.
Table of Contents
- Why Grip Strength Matters in Baseball
- The Standard, Research-Backed Grip Test Protocol
- What Baseball Grip Norms Actually Mean
- Advanced Grip Tests That Catch What Full-Grip Misses
- Common Pitfalls That Produce False Readings
- How Dexdia's Tools Fit This Protocol
- Quick Field Checklist for Testing Day
- The Overlooked Half of Grip Testing
- Get Consistent Grip Data With Dexdia
- Sources
Why Grip Strength Matters in Baseball
Grip strength is not just a hand measurement in baseball. It's a proxy for how well force moves through the kinetic chain, from the legs through the hips and torso and out through the hands at contact or release.
Researchers studying 129 male baseball players found that each additional kilogram of dominant grip strength in the 0/90 position predicted roughly a 0.3 mph increase in peak exit velocity, even after controlling for age, height, and weight. That's not a small effect across a full roster. A hitter who adds significant grip strength through targeted training could plausibly improve exit velocity by a measurable amount, all else equal.
Grip strength and exit velocity: Each 1 kg increase in dominant grip strength was linked to about a 0.3 mph gain in exit velocity (p < 0.001).
Grip also functions as an early fatigue sensor for pitchers. The forearm and hand musculature take on significant strain stabilizing the wrist and elbow during repeated max-effort throws. When that capacity drops:
- Medial elbow loading tends to increase, since the forearm can no longer buffer valgus stress as well.
- Stride length and delivery mechanics often shift to compensate for reduced grip control.
- NSCA guidance ties grip function directly to output in rotational power sports, treating it as a trainable performance variable, not a side note.
The Standard, Research-Backed Grip Test Protocol
Coaches often skip standardization, and that's exactly why so much grip data across programs is not comparable. Clinical studies use a consistent testing protocol precisely so results can be checked against normative tables, and you should copy it directly.
Device setup. Use a calibrated hydraulic dynamometer or a validated digital equivalent, ideally one with a Jamal-style span. Set the handle to the second notch, or the manufacturer's standardized setting, since span changes the force an athlete can generate. A device with wildly different handle geometry from what norms were built on will quietly skew your comparisons.
Positions to test.
- 0/90 side position (elbow flexed 90°, shoulder neutral, standing or seated): the baseline test for every player.
- 90/90 position (shoulder abducted 90°, elbow flexed 90°): useful context for overhead athletes.
- Overhead position (arm raised, elbow extended): essential for pitchers, since overhead grip being weaker than side grip is an early red flag for shoulder or elbow dysfunction.
Trial structure. Three maximal squeezes per hand, 3 to 5 seconds per squeeze, 30 seconds of rest between trials. Record the mean of the three trials in kilograms, though some normative tables reference the second trial specifically, so note which convention you're using and stay consistent.
Testing logistics. Test the same arm order every session, use identical verbal encouragement (or none), and check device calibration on a regular schedule. Log everything into a single running dataset. A single test is a data point; a season of tests is a baseline you can trust.
Pro Tip: Test grip first thing in a session, before any bullpen work, medicine ball throws, or lifting. Post-activity grip readings without a matched pre-activity number are almost useless for fatigue tracking.
What Baseball Grip Norms Actually Mean
Population-wide grip norms, the kind built from general adult samples, tend to undersell what's normal for a trained baseball athlete. A validated normative dataset built for athletic populations gives a far more honest comparison point than a generic clinical chart, and baseball-specific ranges by age and position give you the closest thing to a true benchmark.
Some interpretation rules worth building into your process:
- Dominant hand advantage: Expect the throwing/dominant hand to test 7 to 12% stronger than the non-dominant hand in most healthy players.
- Asymmetry ceiling: Asymmetry up to roughly 15% is generally within normal variation; beyond that, it's worth a closer look at training history or recent injury.
- Overhead versus side: In healthy overhead athletes, overhead grip strength often runs about 2% higher than side grip. A reversal, where overhead grip is meaningfully weaker, deserves attention rather than a shrug.
- Trend over snapshot: A single low reading means less than a downward trend across three or four sessions.
When asymmetry exceeds the normal range, or overhead grip drops well below side grip, that's the point to reduce throwing volume for a few days and retest rather than push through. Persistent asymmetry alongside elbow or shoulder discomfort is a referral situation, not a wait-and-see one.
Advanced Grip Tests That Catch What Full-Grip Misses
Full-grip dynamometry has a blind spot. It can look completely normal while individual finger flexors are already fatigued, which matters because pitchers rely heavily on fingertip control for spin and command.
Research on simulated pitching sessions shows finger-specific testing can reveal drops greater than 20% in isolated finger or pinch strength while full-grip scores stay essentially flat.
That gap is why a complete monitoring approach layers in more than one measure:
- Three-finger or isolated-finger tests: Highlight fatigue in the flexor digitorum muscles that a full crush grip test can miss entirely.
- Pinch strength tests: A simple pinch gauge reading tracks thumb-to-finger force, relevant to grip control on breaking pitches.
- Bar hang or timed endurance holds: Reveal how long an athlete can sustain sub-maximal grip, a different quality than peak force.
- Farmer's carry progressions: Build and test loaded-grip endurance relevant to a full nine-inning workload.
For cadence, test pitchers pre- and post-outing during the season, and run the fuller battery, including finger-specific checks, weekly or before each start. Combine a grip drop with a pinch-strength drop and you have a real fatigue flag worth acting on, not just noise from one off day.
Common Pitfalls That Produce False Readings
Bad grip data usually isn't a device problem. It's a process problem.
- Inconsistent handle span: Switching devices or grip settings between sessions changes the numbers independent of any real strength change, since optimal span sits near 55 mm for most adult hands and deviations reduce output.
- Uncontrolled encouragement and order: A louder tester or a different testing order can shift results by a meaningful margin, so standardize both.
- Overreacting to one number: A single low trial is often a learning effect or simple variance, not a fatigue signal. Trends across sessions carry the real information.
- Ignoring calibration drift: Hydraulic dynamometers lose accuracy over time without recalibration, quietly corrupting a season's worth of comparisons.
How Dexdia's Tools Fit This Protocol
Running this protocol by hand, with a stopwatch and a notebook, works. It's also where most programs lose consistency, since device calibration and manual logging are the biggest sources of tester-to-tester error in the field.
The DEXDIA GX connects over Bluetooth to a companion app, so every trial from every position logs automatically instead of getting scribbled on a clipboard and transcribed later.
- Automated logging removes the transcription errors that quietly distort season-long baselines.
- Built-in symmetry analysis flags dominant-versus-nondominant gaps against the 7 to 12% typical range automatically.
- Sport-specific comparison tools benchmark a player against baseball norms, not generic population charts.
Pro Tip: Use the pre-outing baseline feature to flag any pitcher whose grip reading falls more than 10% below their rolling average before they take the mound, not after.
Quick Field Checklist for Testing Day
- Set the dynamometer to the standard handle span and confirm calibration.
- Test 0/90 side grip on both hands; add overhead position for pitchers.
- Run three trials per position, 3 to 5 seconds each, 30 seconds rest between.
- Log the mean in kilograms immediately, same order every session.
- Flag any reading 5 to 10% below baseline for follow-up before the next outing.
Pitchers warrant pre/post testing every outing; position players are well served by a weekly or biweekly check during the season.
The Overlooked Half of Grip Testing
Most grip testing guides stop at the crush grip number, and that's the gap this protocol is built to close. A single 0/90 reading tells you something about maximal force, but it says almost nothing about whether a pitcher's fingertip control is degrading three innings into a start, or whether an overhead deficit is quietly building toward a shoulder problem.
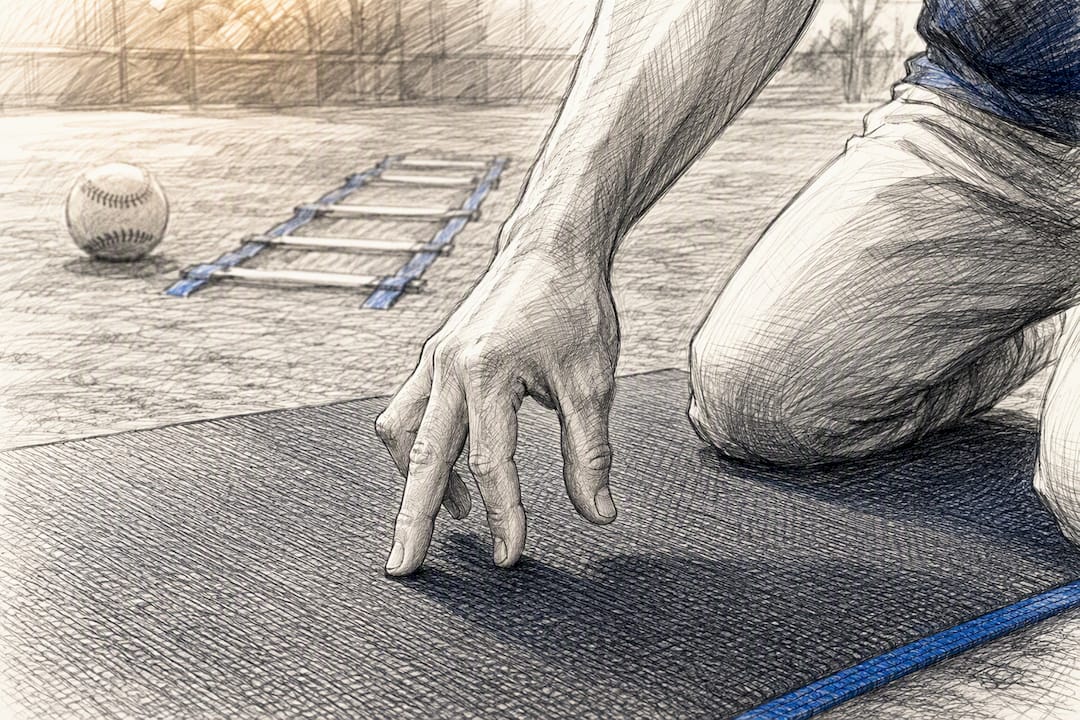
The conventional advice, test grip once a preseason and move on, treats grip strength like a fitness test instead of a monitoring tool. That's backwards. The real value shows up in the trend line: baseline, in-season checks, and the finger-specific and overhead measures that a basic crush test simply cannot see.
If you take one thing from the research, prioritize consistency over sophistication. A simple 0/90 test run the same way every single time beats an elaborate battery run inconsistently. Add the overhead and finger-specific checks once that foundation is solid, not before.
— Dexdia Team
Get Consistent Grip Data With Dexdia
Manual clipboard testing gets you a number. It doesn't get you a symmetry analysis, a trend line against your own team's baselines, or a comparison to baseball-specific norms without hours of spreadsheet work. That's the gap Dexdia's tools are built to close.
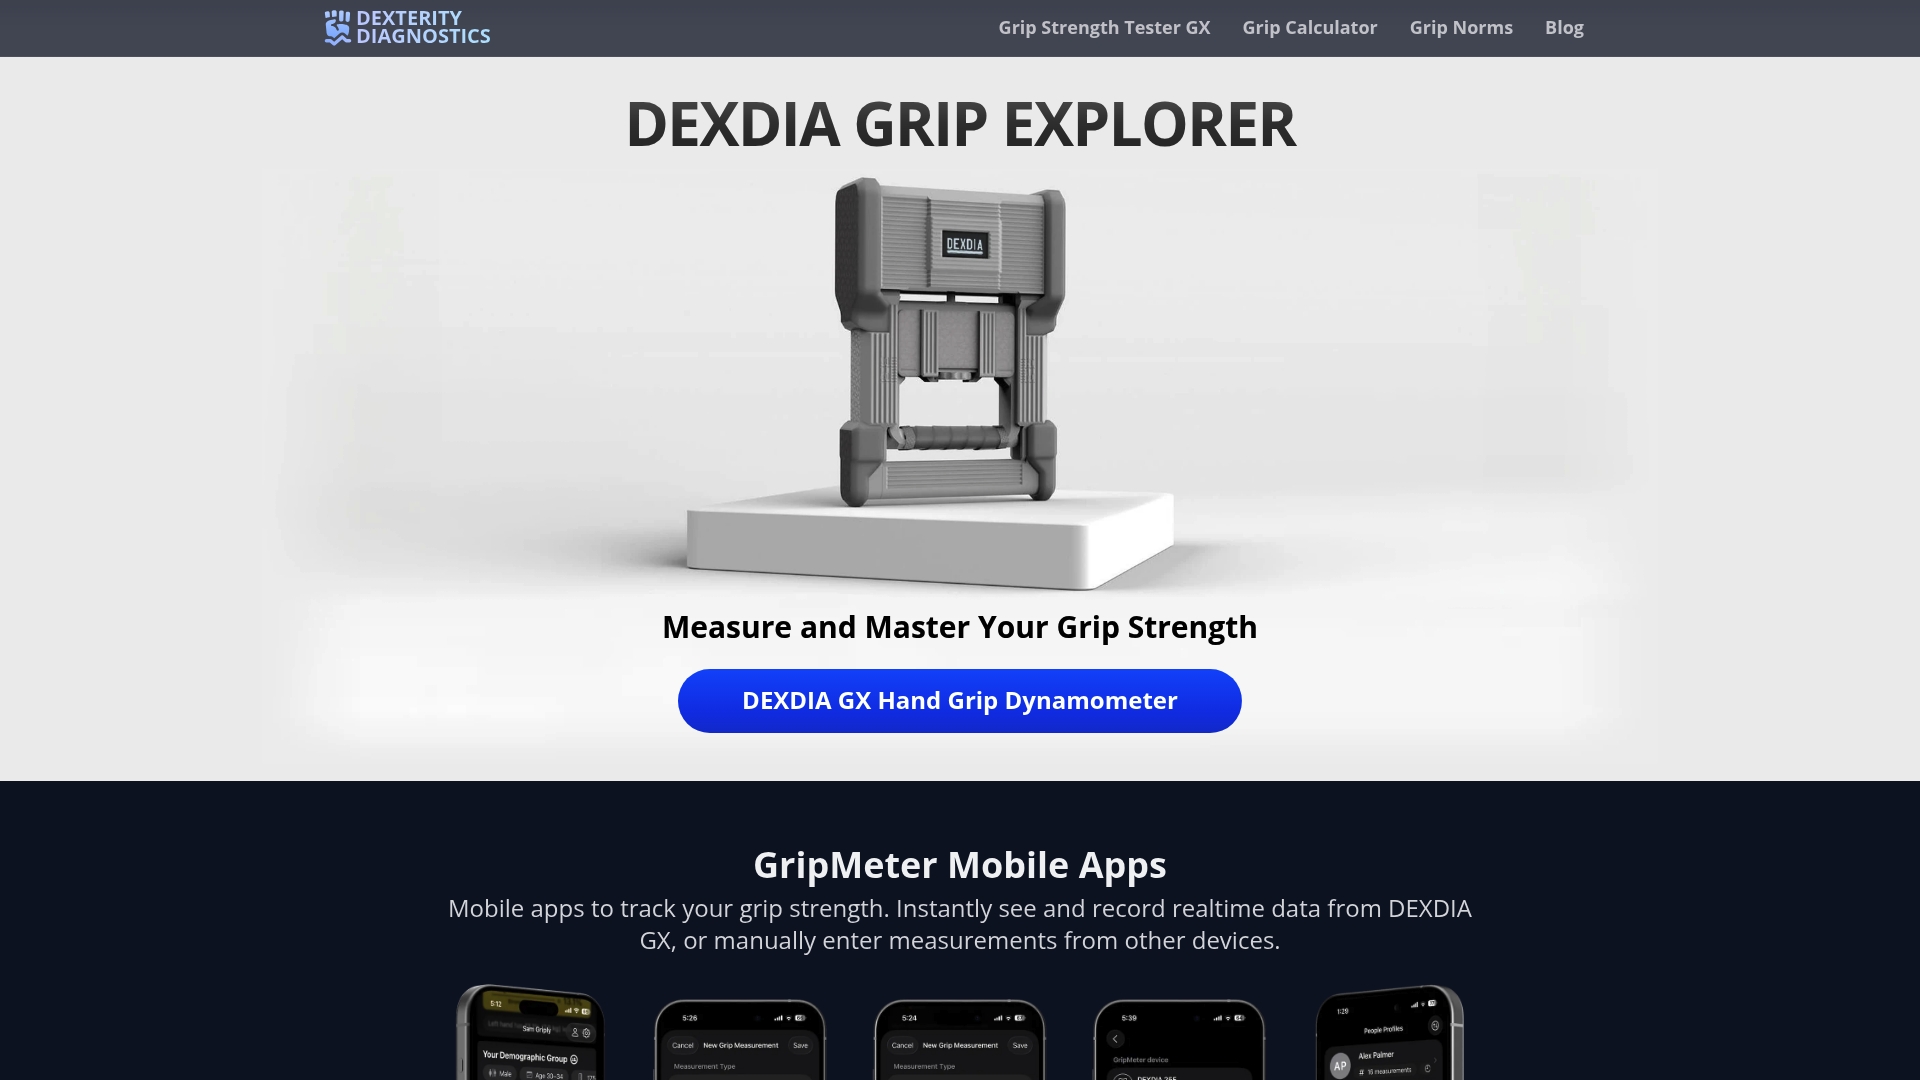
The DEXDIA GX pairs with a mobile app that logs every trial automatically, calculates left/right symmetry, and benchmarks results against sport-specific data instead of generic population charts. It suits programs running the pre/post outing protocol described above, and individual players tracking their own progress between seasons. If your team is already running dynamometer tests by hand, the grip strength calculator is a fast way to check where a current reading falls against normative ranges before you invest in dedicated hardware. For programs ready to build a real season-long dataset, start with a baseline test on the DEXDIA GX and let the app carry the tracking from there.
Sources
- Isolating the effect of grip strength on exit velocity in male baseball players
- Grip strength testing protocols with normative data (PMC article)